
Compensation strategyHiring & offers
Half of Reward teams never grow beyond one person
When do companies make their first Reward hire, and how fast does the team grow? Ravio data on total rewards team structure, from first hire to team of five.


Uncompetitive pay doesn’t just make it harder to hire. It can make it harder to keep the employees you already have.
In Ravio’s 2025 Compensation Trends survey, 69% of People and Compensation professionals shared uncompetitive cash compensation as a main challenge when attracting talent. And 61% said the same when it came to retaining talent.
Compensation is always going to be an important factor in employee engagement – but the tricky part is knowing when it’s actually putting retention at risk.
An employee’s pay can gradually fall behind the market. New hires can start earning close to, or more than, experienced employees. Or pay decisions made over time can leave comparable employees positioned very differently.
None of these automatically leads to attrition.
But they can develop quietly, and by the time an employee tells you pay is a problem, they may already be looking elsewhere.
So how do you spot the warning signs earlier?
This guide covers the signs that your compensation could be affecting employee retention and how to identify where the risk sits before deciding what needs fixing.
There’s no single metric that tells you compensation is causing employees to leave.
Turnover might increase for several reasons, from poor management to limited career progression.
And even when departing employees cite pay as the reason, that only tells you about the problem after they’ve decided to leave.
The solution? Get proactive about identifying attrition risk.
Look for patterns across your retention and hiring data that suggest compensation could be contributing to the problem:
Start with one of the clearest signals: what employees tell you when they leave.
Review exit interview data and reasons for voluntary turnover over time.
If you collect compensation-related responses in engagement or pulse surveys, look for the same patterns there too – particularly declining scores within specific roles, levels, or locations.
Rather than focusing on an individual employee citing compensation, look for recurring patterns:
For example, one software engineer leaving for a 15% pay increase doesn't necessarily mean you have a compensation problem.
But if several engineers at the same level leave for higher-paying roles within a few months, you have a much stronger signal that their pay may no longer be market competitive.
Sometimes a compensation problem shows up in recruitment before it shows up in retention.
Look at whether:
Again, the pattern matters.
One rejected offer tells you little. But if you repeatedly struggle to hire for the same role or location at your existing range, it can signal that market rates have moved ahead of your compensation structure.
And if you’re struggling to attract new employees at those rates, it’s worth checking whether existing employees doing the same work are now being paid below the market too (more on how to do this below).
Another sign to look for is whether longer-tenured employees are progressing through their salary bands over time.
If many remain at or near the bottom of their ranges despite gaining experience, their salaries may not be keeping pace with their progression.
It could also point to limited pay increases or inconsistent pay and promotion decisions.
Again, being low in a salary band isn’t inherently a problem.
But when experienced employees consistently cluster there, it’s a pattern worth examining – particularly if you’re also seeing higher turnover or compensation concerns among the same roles or employee groups.
Finally, review whether experienced employees earn little more than new hires doing comparable work – known as pay compression.
This can happen when market salaries rise faster than internal pay.
You increase starting salaries to remain competitive when hiring, but existing employees’ salaries don’t move at the same pace.
When that happens, the gap can be significant.
Ravio’s data for P3 Software Engineers across Europe, for example, found that new hires earned 14% more than existing employees in February 2025, with a similar 12.3% new-hire premium appearing again in February 2026.
Promotion practices can contribute to this too.
It’s common to move a newly promoted employee to the bottom of their new salary band, while external hires at the same level may enter closer to the midpoint or negotiate a higher starting salary.
You can then end up with a long-tenured employee who has earned their progression sitting below a new hire doing comparable work.
Over time, these differences can leave experienced employees feeling that their progression or contribution isn’t reflected in their pay – increasing the risk that they look elsewhere.
By the time an employee resigns and tells you they’ve accepted a better-paying offer elsewhere, it’s often too late to address the compensation problem that contributed to it.
The goal, then, is to identify those warning signs earlier:
That means looking at your compensation proactively rather than waiting for your next pay review or an employee resignation to expose a problem.
Here’s how to find those potential retention risks and decide where you need to take action:
A spreadsheet can tell you that an employee has a compa-ratio of 0.82 (their salary is 82% of the midpoint of their pay range).
But when salary, band range, level, location, and compa-ratio sit in different columns, you still have to piece together what that number actually means.
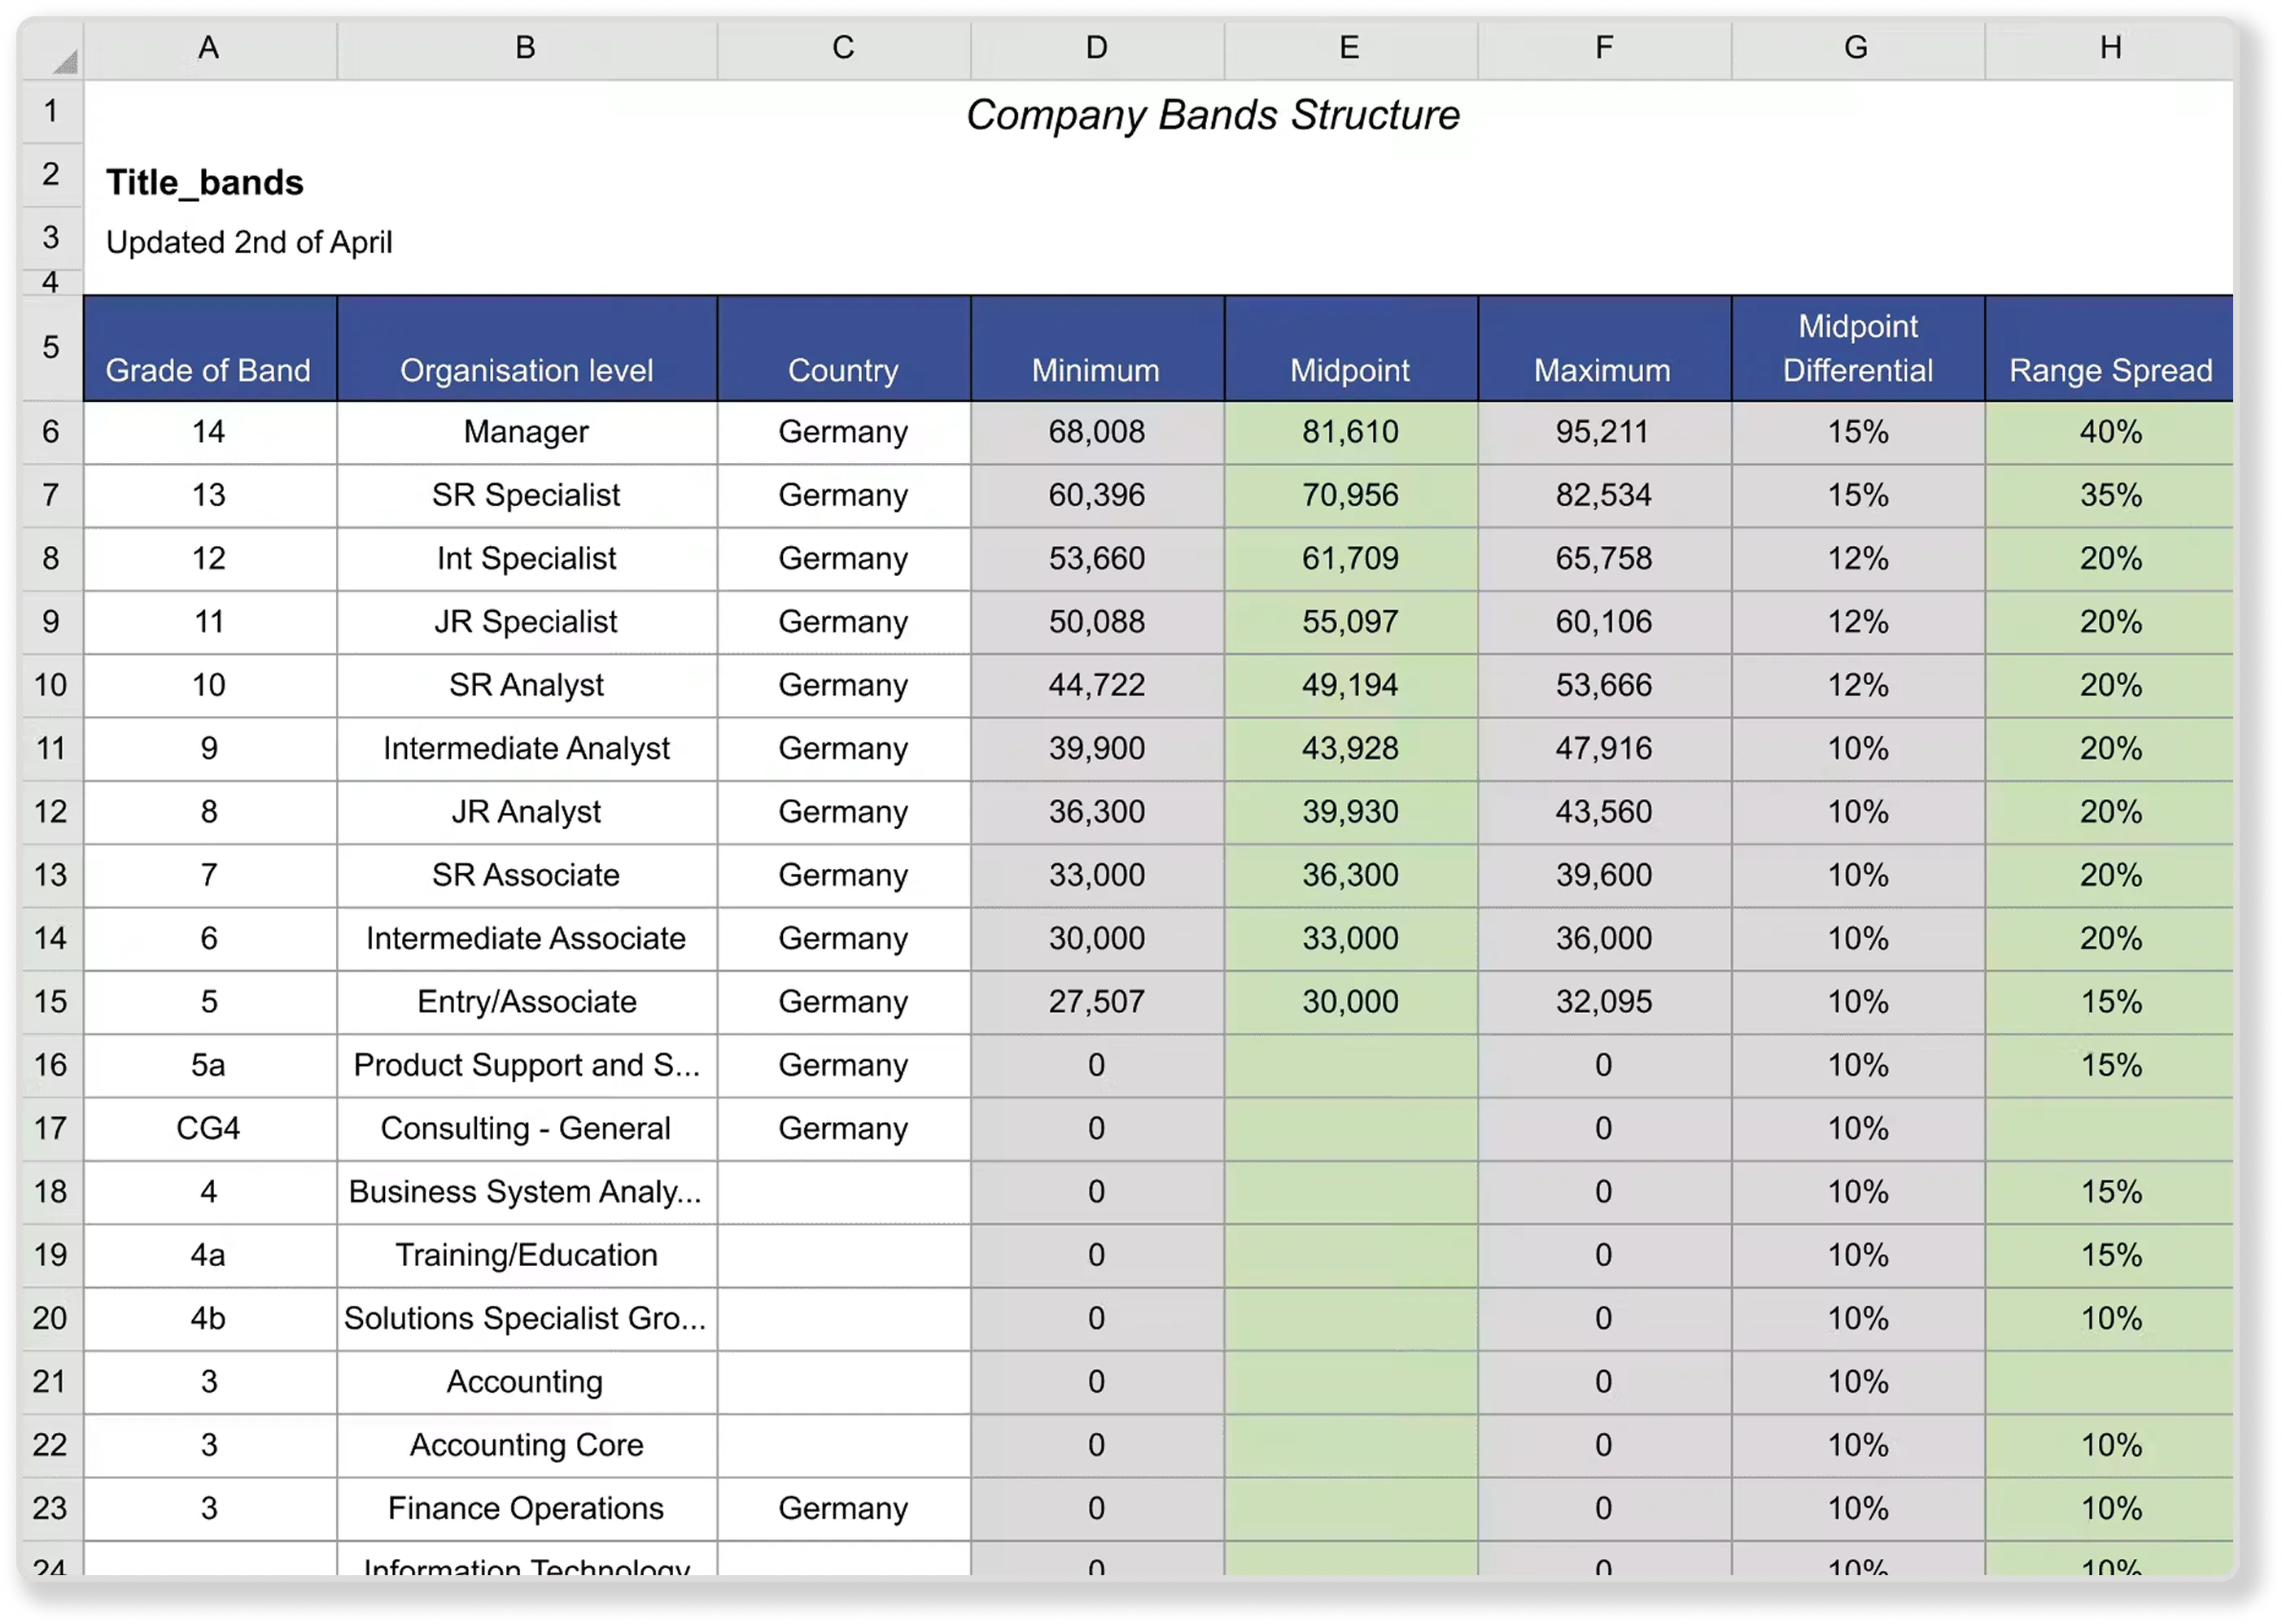
And because spreadsheets give you a static snapshot, gradual changes are easy to miss.
An employee’s pay can slowly fall behind as market rates move or new hires join at higher salaries, without an obvious red flag appearing.
So the first step here is reviewing employees’ compa-ratios.
Doing so visually in a tool like Ravio, to see compa-ratios within the context of your salary band structure, makes it much easier to see how employees are positioned across their ranges and spot potential retention risks much faster.
Start by either importing your salary bands (if you have them ready) or building your salary bands under Bands on the left-hand sidebar in Ravio – it takes minutes to set up, and then you can see where employees sit within their ranges at a glance.
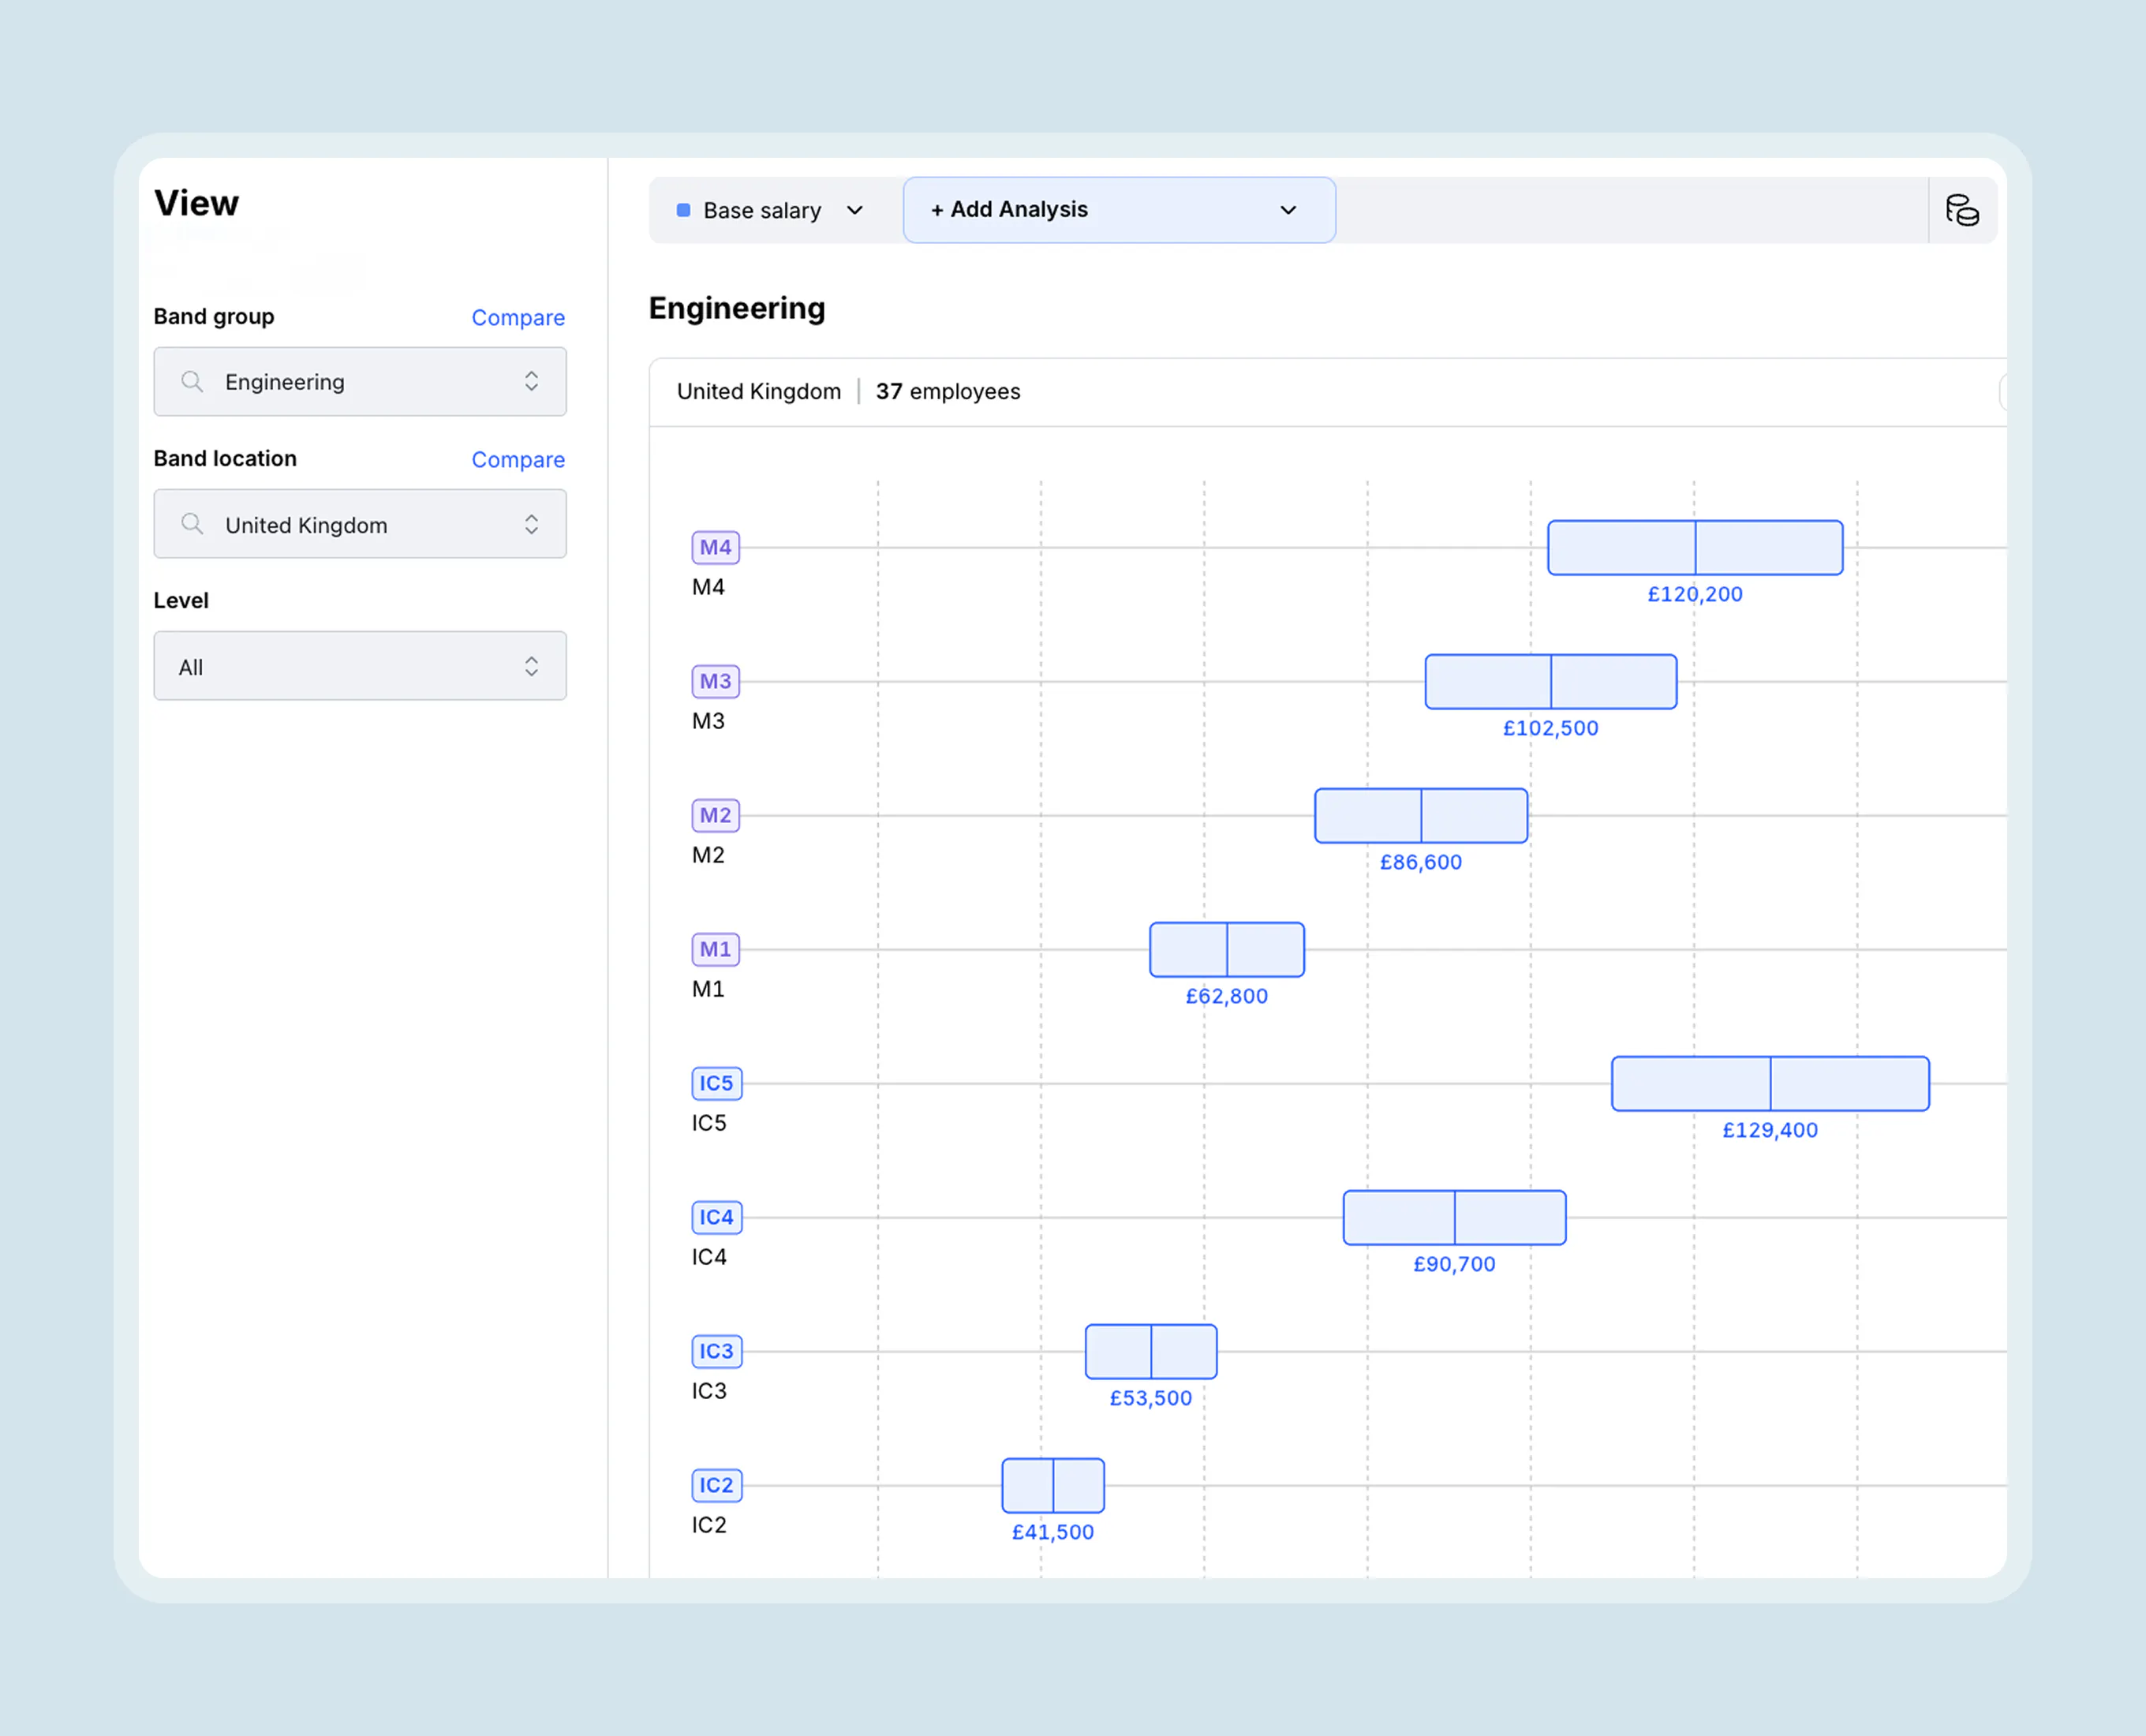
With your salary bands set in Ravio, you can see employees plotted according to where their salary sits within the range, rather than needing to interpret a long list of compa-ratios.
Next, review how employees doing comparable work are positioned relative to each other.
In Ravio, simply go to the top of your band view page and select the Add analysis tool to review how your employees are distributed within each band.
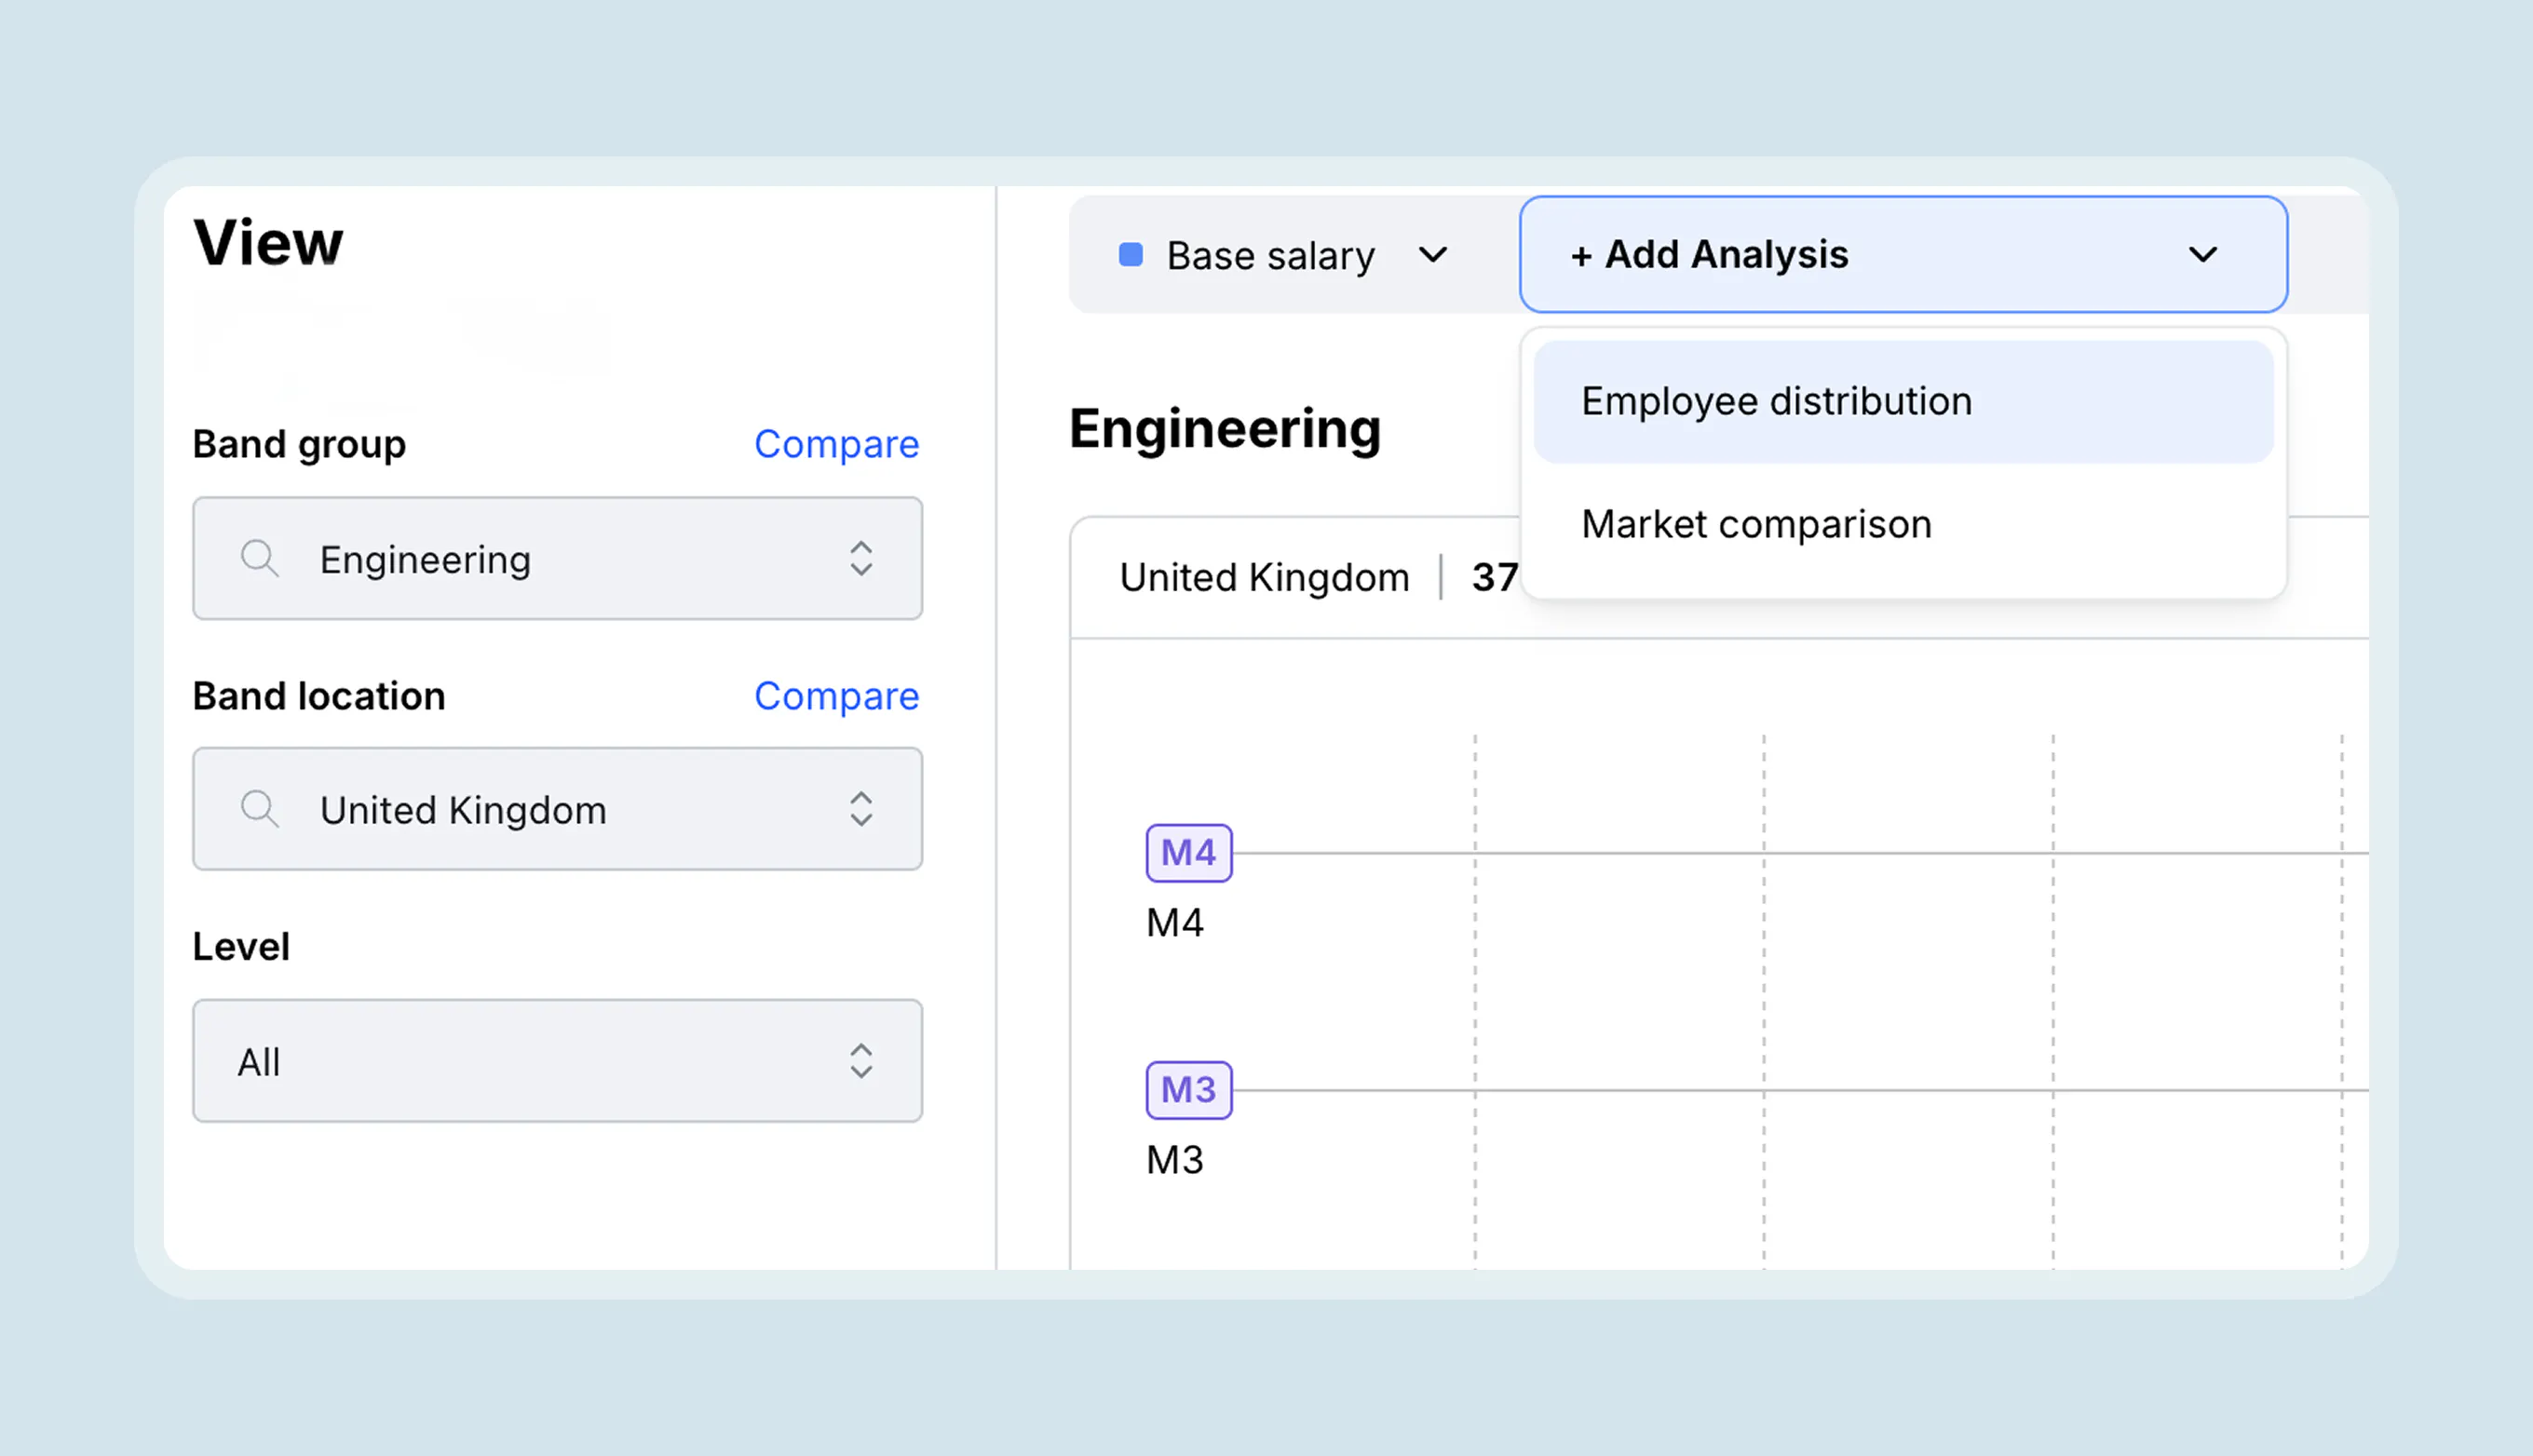
You’re looking for pay differences that warrant a closer look, including potential signs of pay compression. For instance:
These differences don’t automatically mean there’s a problem.
Differences in experience, skills, performance, or other legitimate factors may explain why one employee sits higher in the range than another.
But it enables you to run that analysis, and where there isn’t a clear reason for the difference, you may have surfaced an inconsistent pay decision and a potential retention risk worth addressing before employees start looking elsewhere.
To identify potential reasons behind the pay differences, add more context to your band analysis by asking:
Rather than finding everyone with a low compa-ratio and flagging them for a salary increase, first check whether differences in performance explain why employees sit differently within the band.
Upload your employee performance ratings from your last compensation review cycle in Ravio.
Once you’re in the employee distribution analysis view in Ravio, select Explore: performance to review employees’ performance against their position within the band:
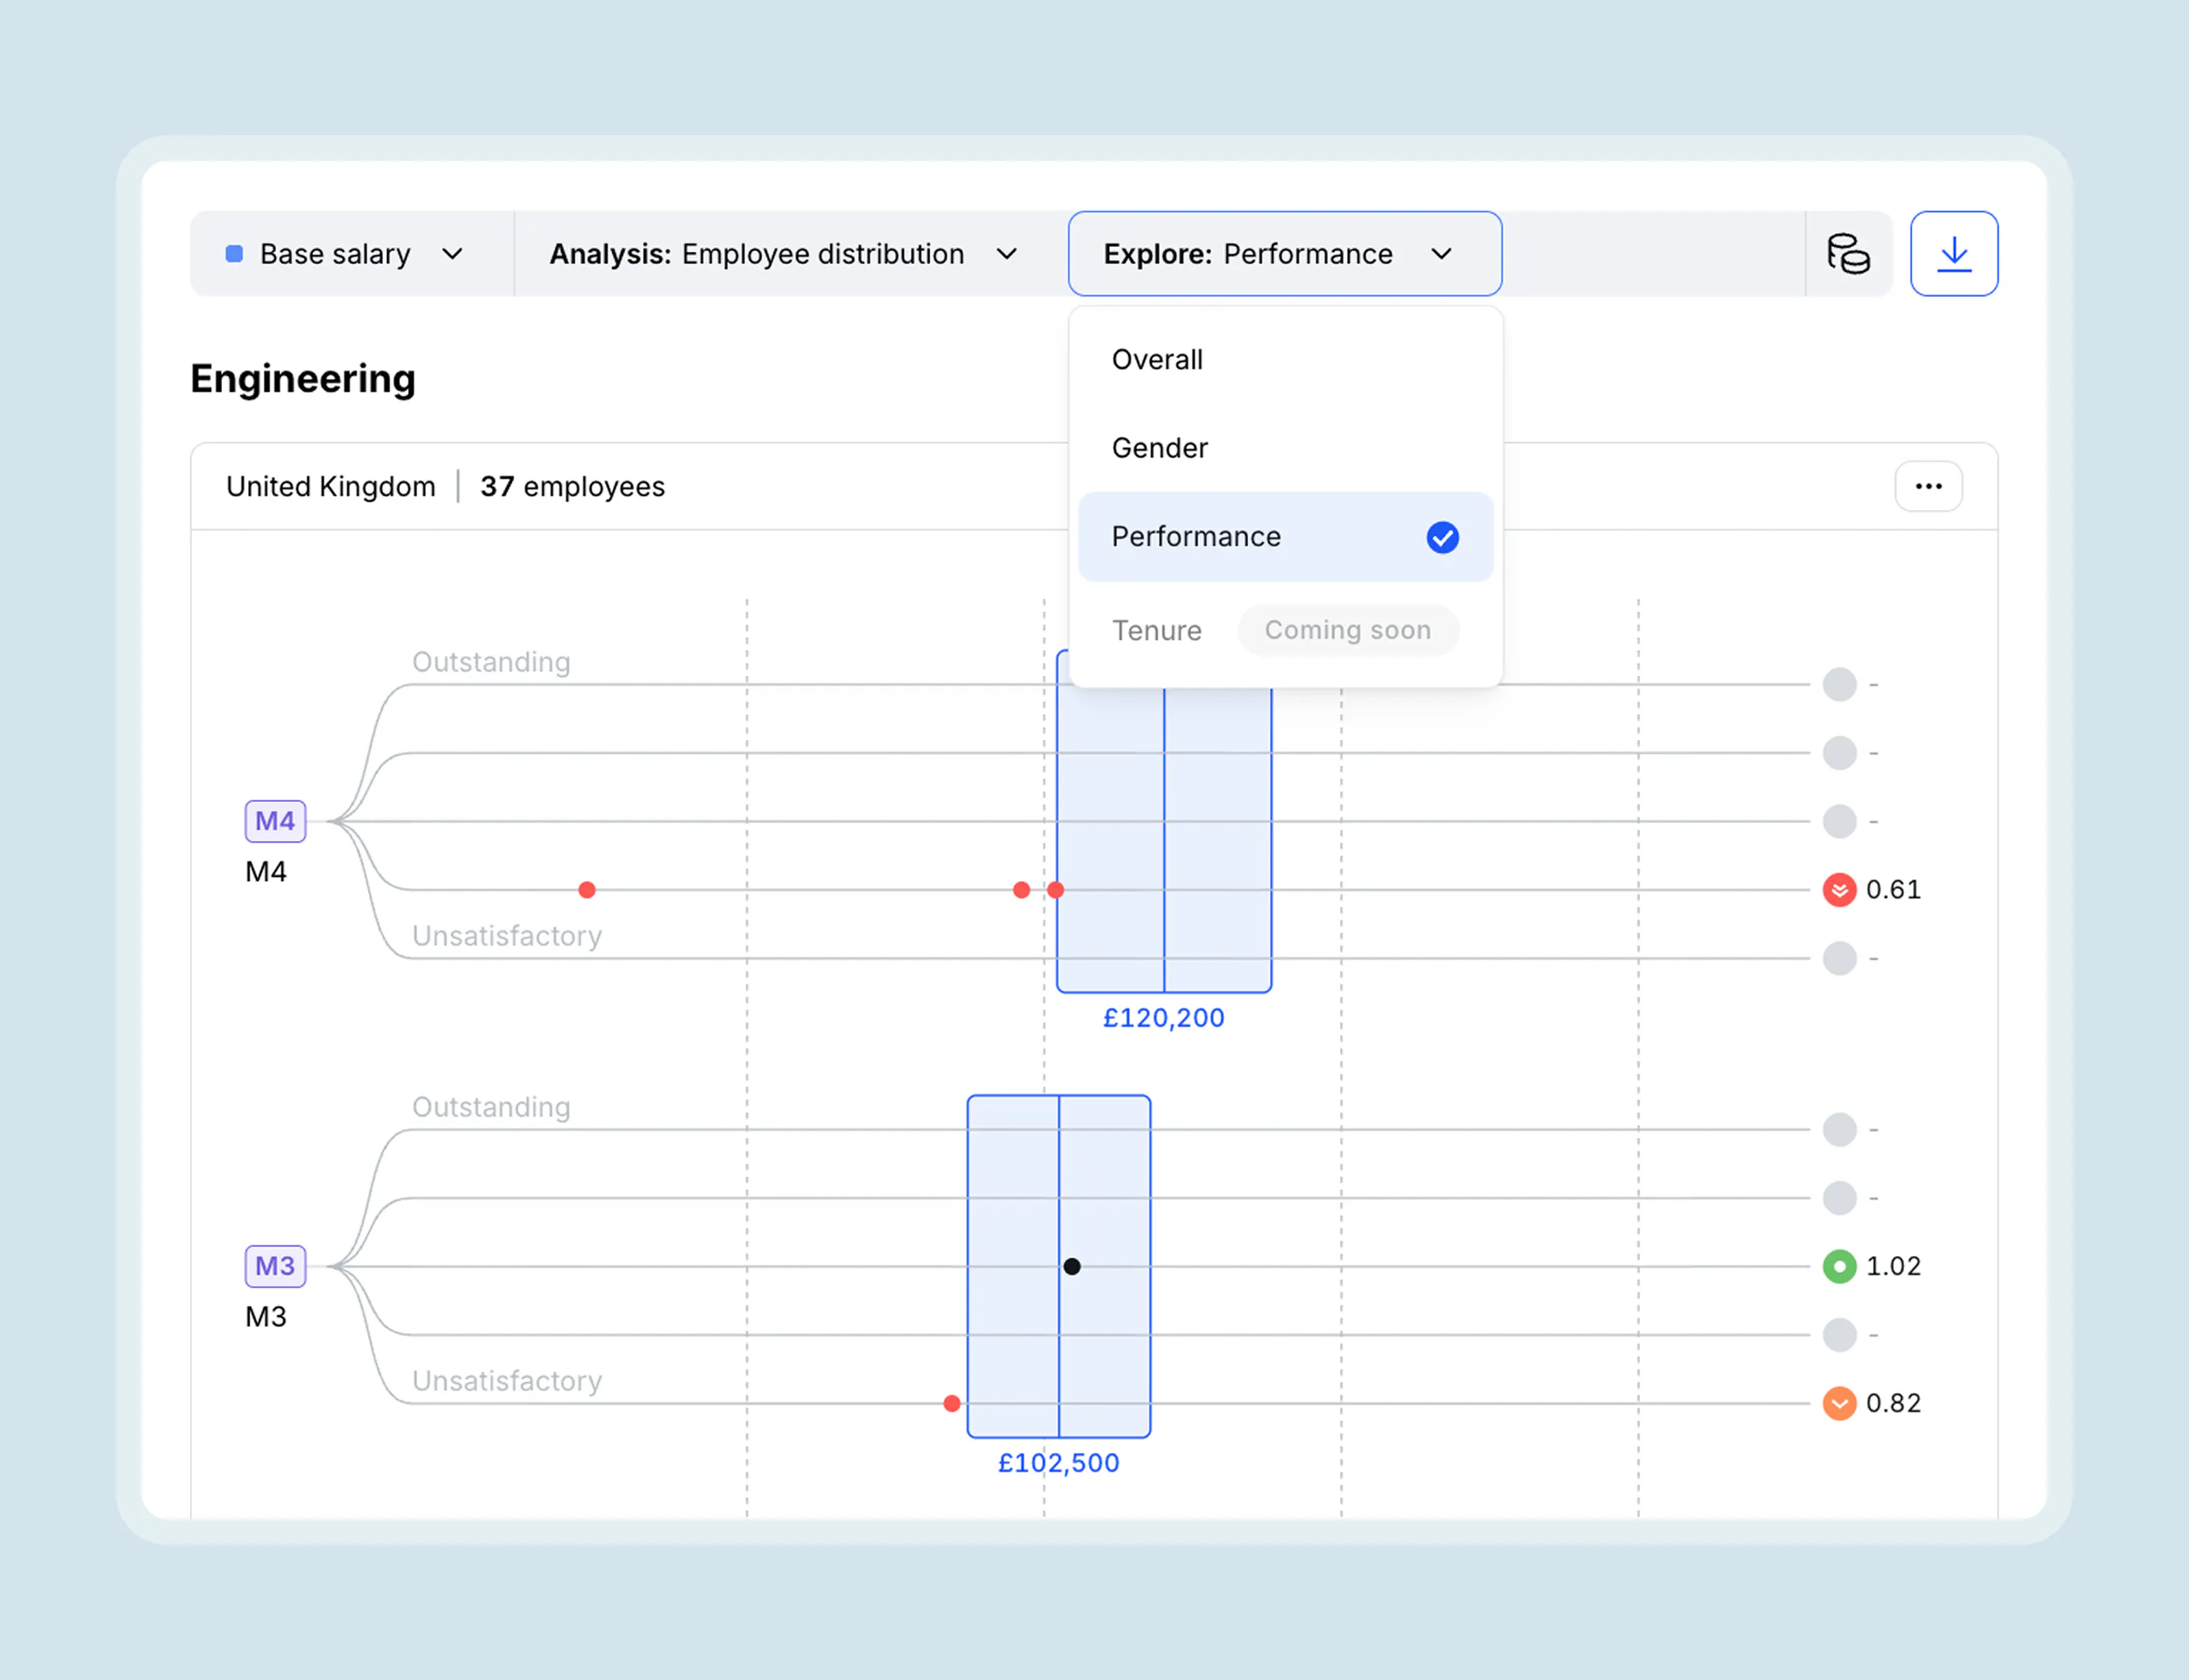
Now look for cases where performance and band positioning appear out of step.
For example, a consistently high-performing employee might sit lower in their range than a comparable employee with a lower performance rating, signalling a pay difference that needs explaining.
This review will also help you distinguish new hires who haven’t yet been through a performance review, as they won’t have a rating. This makes it easier to spot potential pay compression if newer employees sit higher in the band than longer-tenured employees doing comparable work.
Have high performers already at the salary band maximum? Here’s advice on how to retain them.
Inside Ravio, in the same workflow, select Gender from the Explore drop-down to see whether different genders doing comparable work are positioned differently within their ranges.
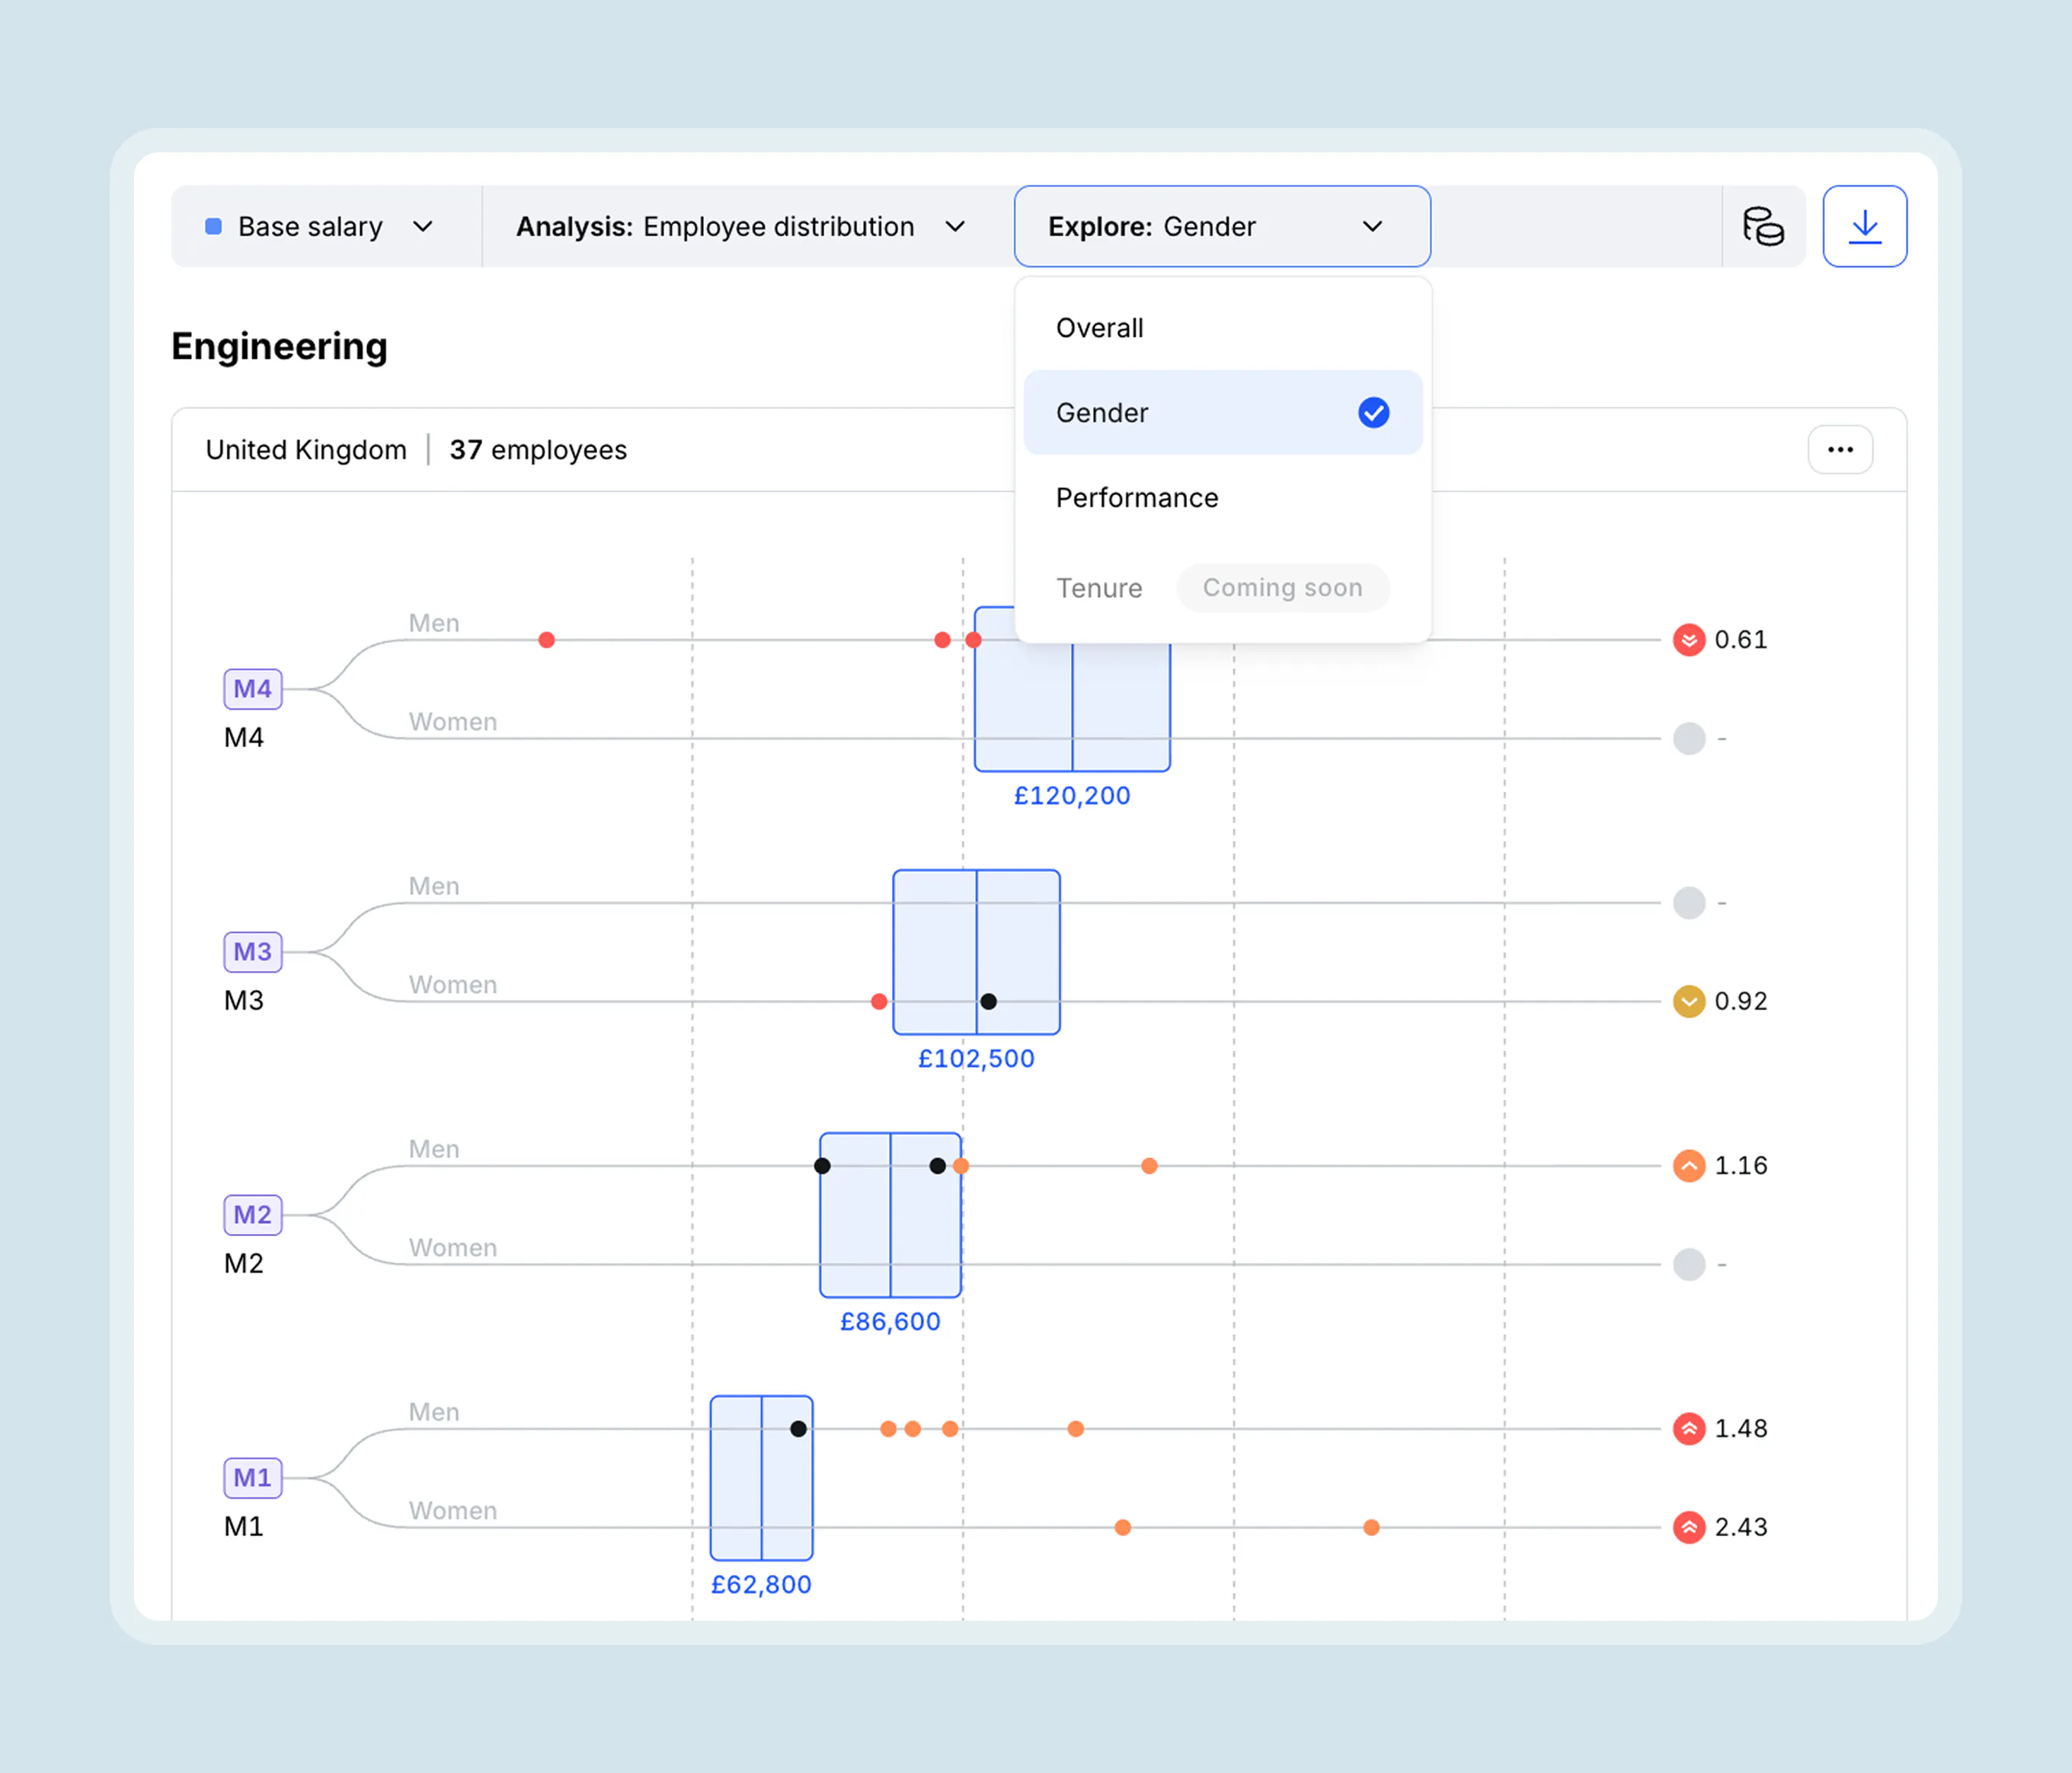
Look for patterns rather than individual outliers.
For example, are women consistently sitting lower within the same bands than men doing comparable work?
This surfaces potential pay equity issues or historic inconsistencies in pay decisions – both of which can contribute to retention risk if left unaddressed.
Dig deeper: How Ravio helps you identify and close pay gaps.
Your employees can be paid consistently relative to each other and still be underpaid compared to the external market.
That’s where compensation-related retention risk can quietly build.
Ravio’s employee departure data actually backs this. In most cases, employees paid above market had the lowest share of departures (14%), versus 15% among employees paid below market. In fact, employees leaving within 0-12 months were predominantly on market-lagging salaries.
Market rates move throughout the year, so if you only benchmark pay ahead of your annual compensation review, an employee’s salary can gradually fall behind what competitors are paying for the same role.
So, once you’ve reviewed internal pay differences, compare employees against current market benchmarks to see where employee pay is starting to fall behind.
In the same Bands-view workflow in Ravio, select Market comparison now to see how your employees and salary bands compare against the market:
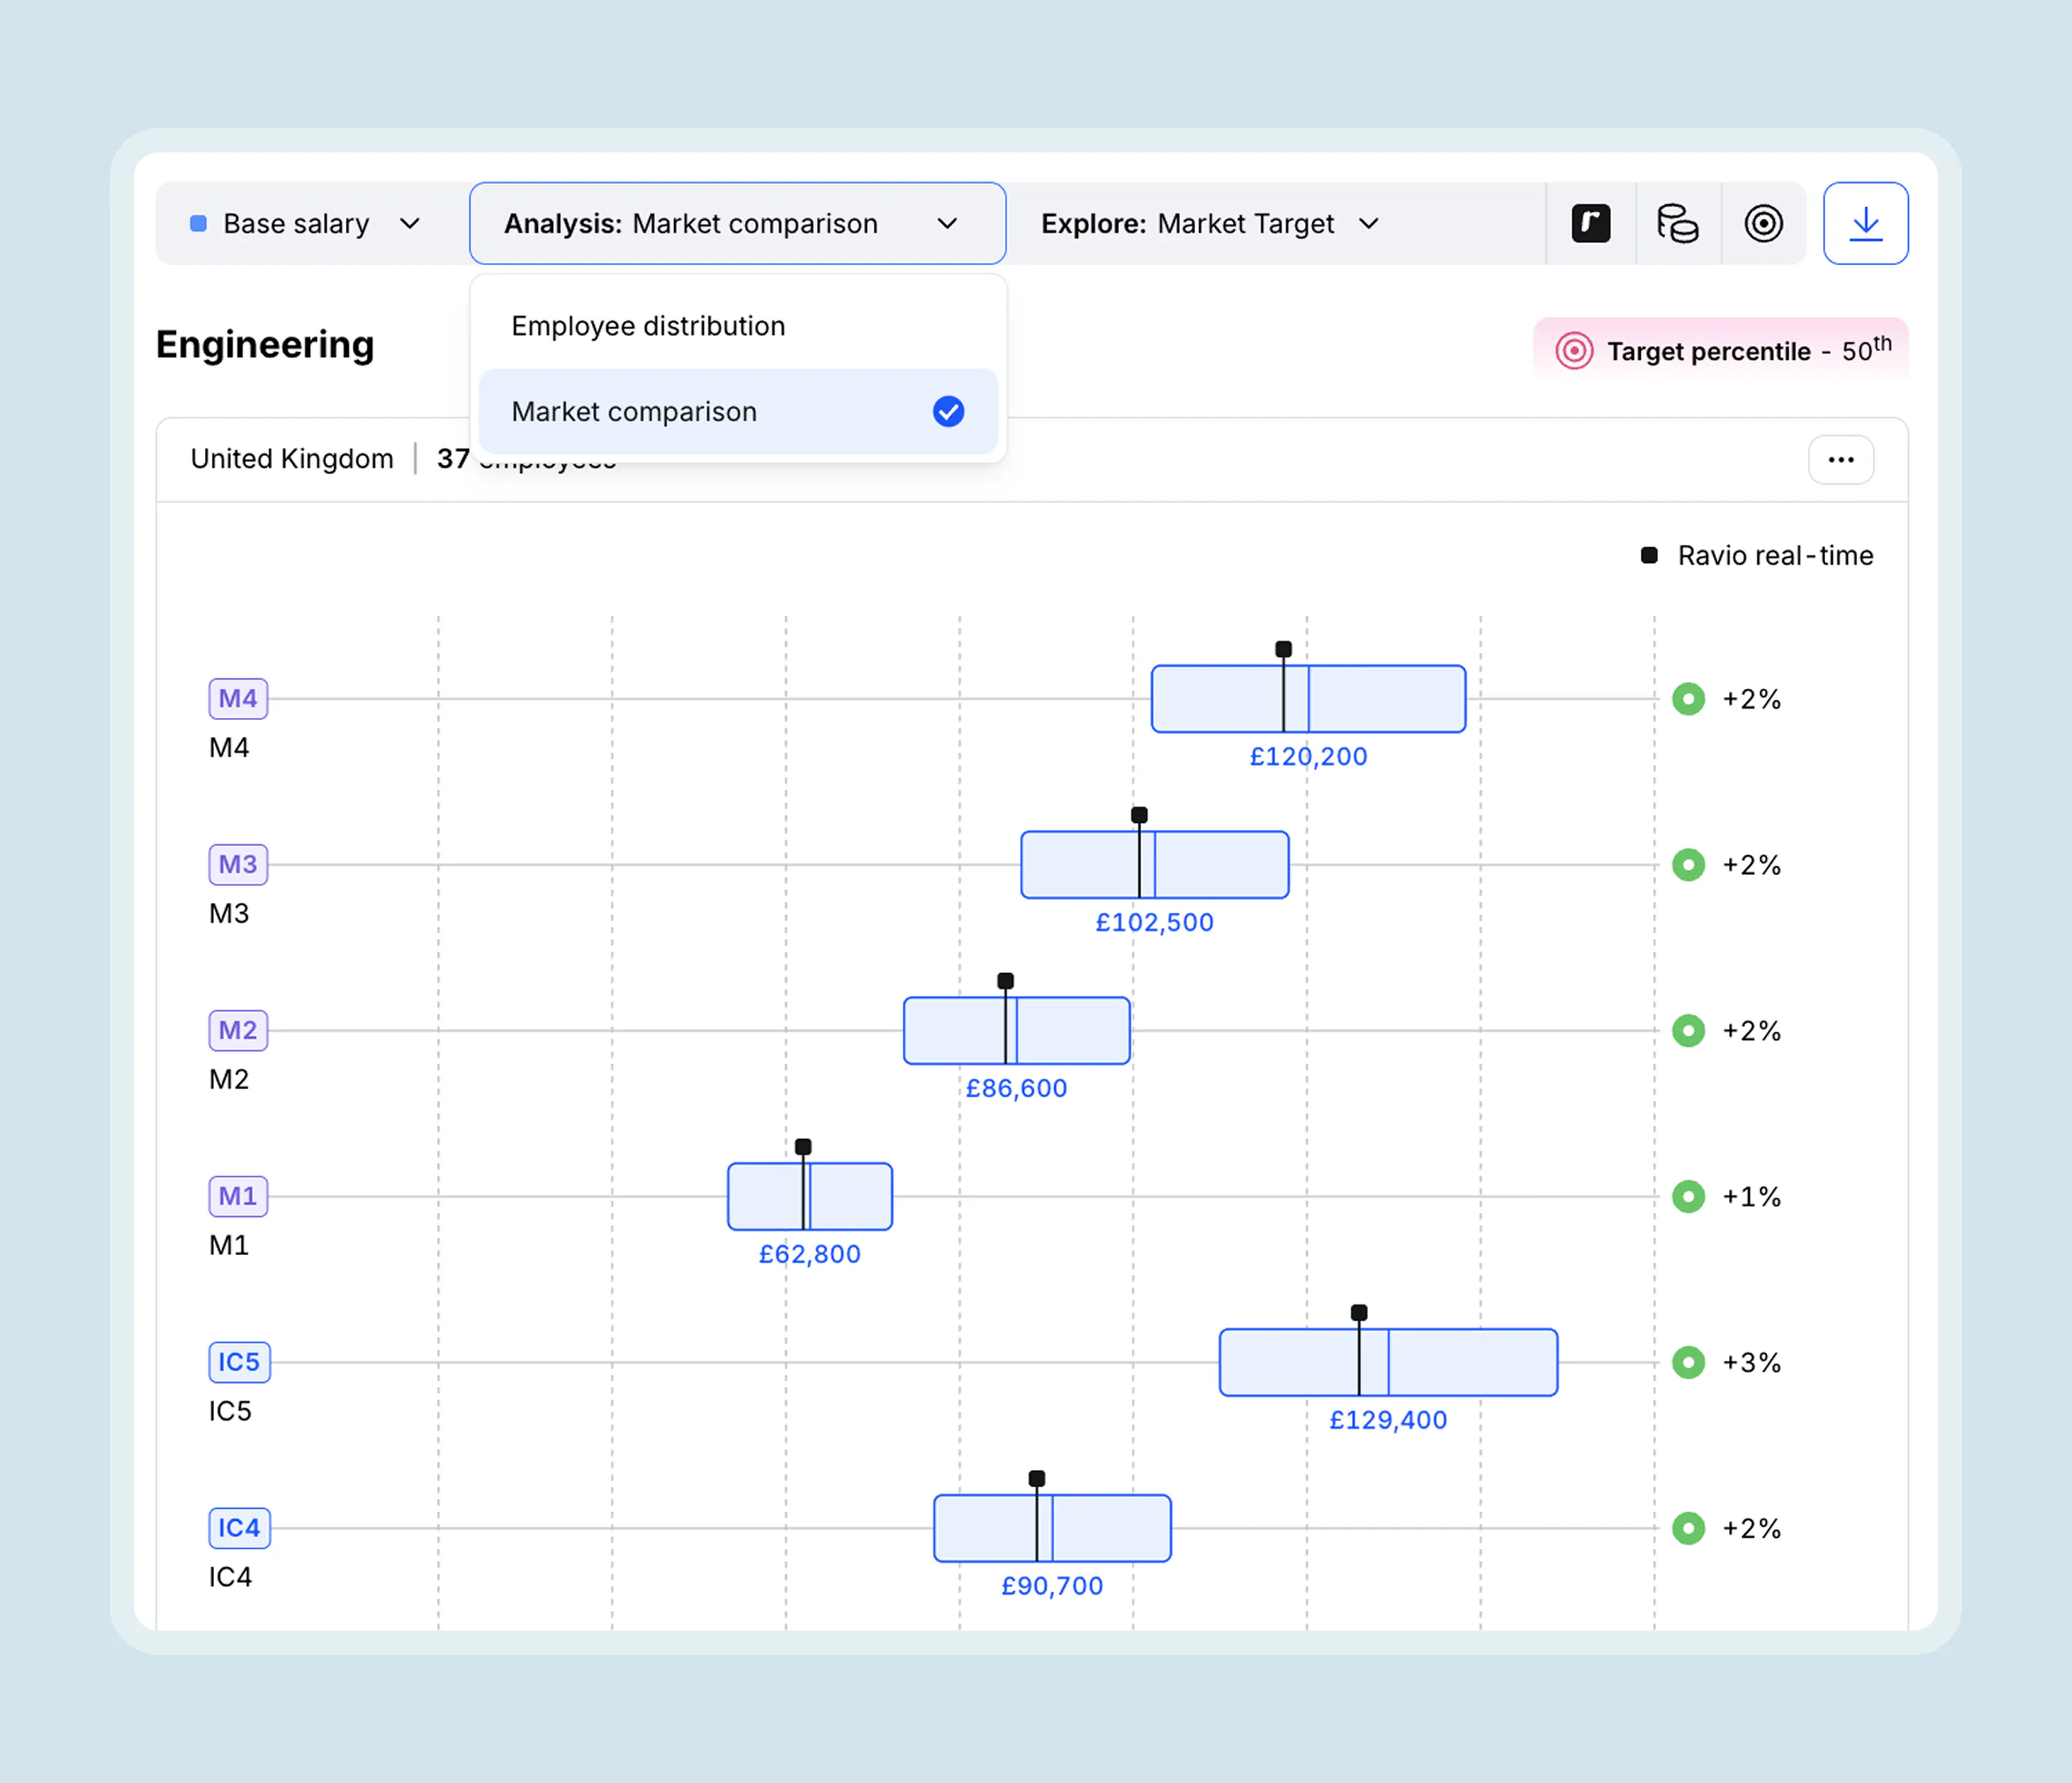
Market benchmarking might reveal, based on your chosen market target, for example:
This gives you a clearer view of where potential retention risk is highest, so you can prioritise market-based adjustments for specific roles or employees that may need attention rather than applying blanket pay increases across the organisation.
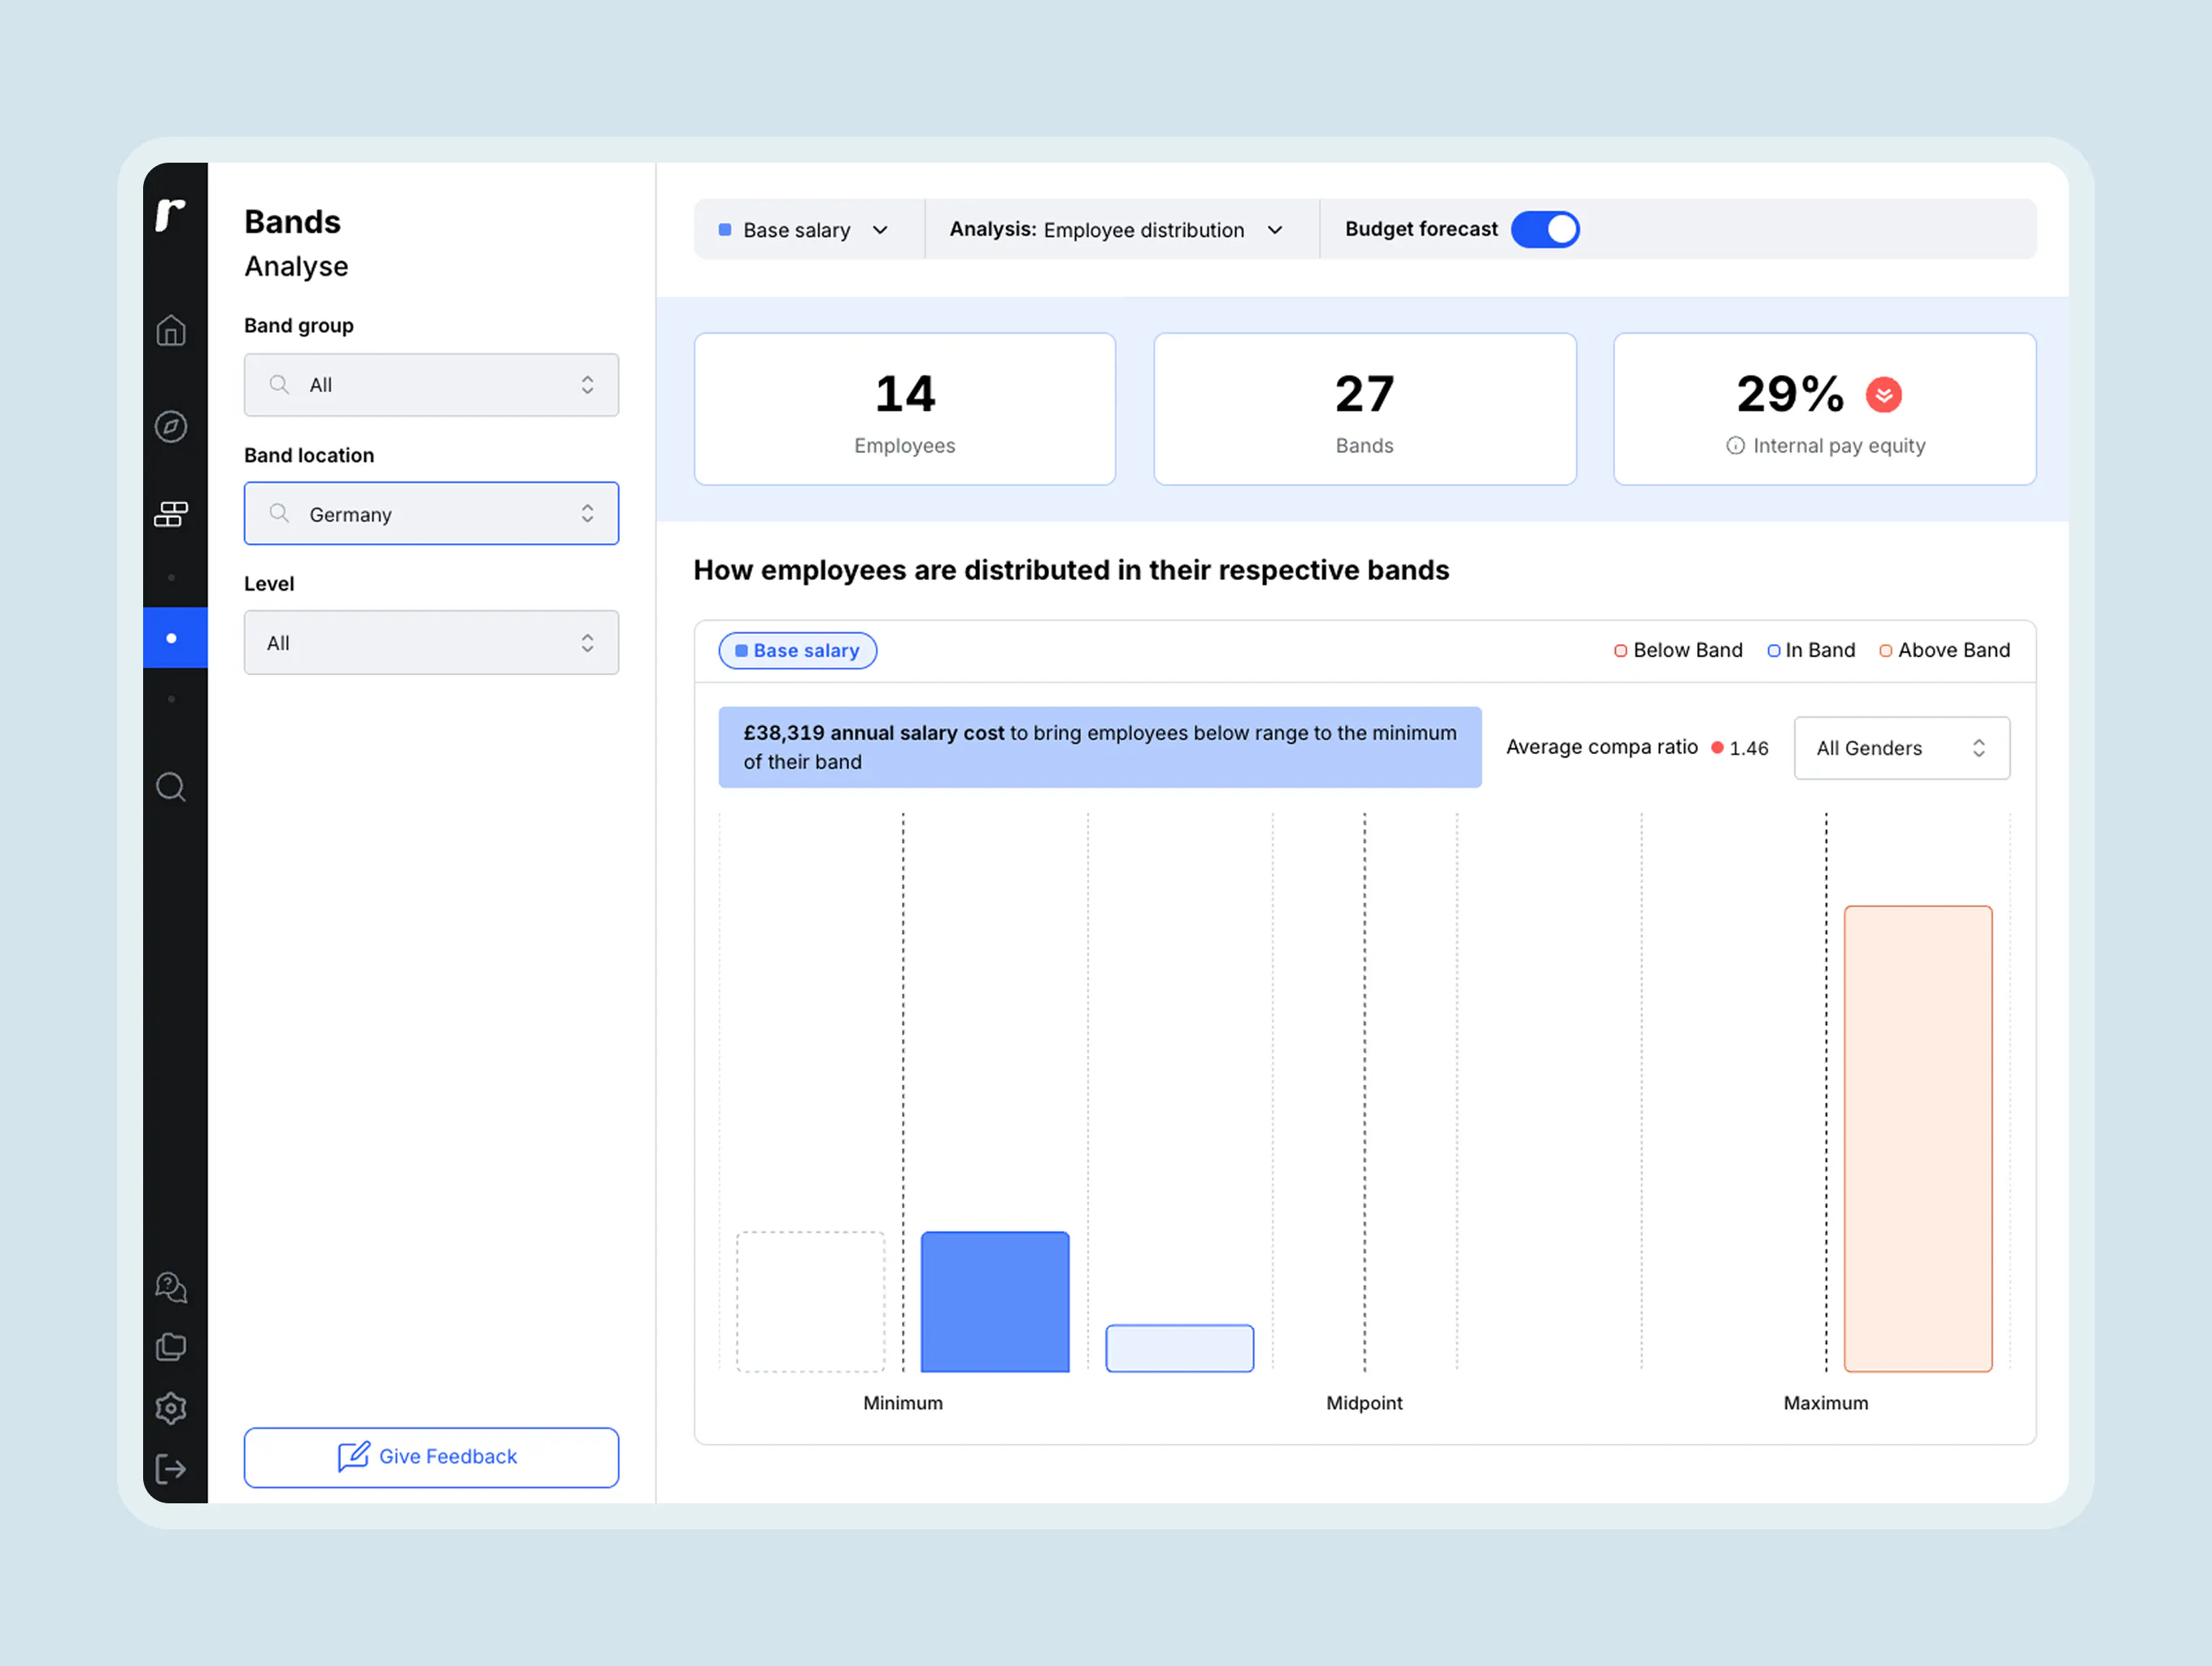
You can also use Ravio to calculate the cost of bringing employees in line with your market target. Head to Bands > Analyse and you’ll see the same filters for employee distribution and market filter, with a Budget forecast toggle beside.
Filter by function, level, or location to model the cost for a specific employee group rather than your entire workforce.
Keep in mind here that benchmark freshness plays a key role here.
If you’re benchmarking against salary survey data, for instance, the market may have moved since the data was collected.
Meaning: an employee can appear competitively paid against your benchmarks while their pay has already started falling behind current market rates.
Comparatively, Ravio’s benchmarks update in real-time as new compensation data flows into the platform via HRIS integrations, giving you a more current view of what the market is paying.
This lets you spot when market pay starts moving away from your own rather than discovering the gap at your next annual review, or when an employee arrives with a higher offer from elsewhere.
To recap, regularly review employee positioning against their peers, salary bands, and the external market to catch gaps in compensation early. Then make targeted adjustments where compensation may be creating retention risk.
“As a Reward leader, it is your sole responsibility to find the sweet spot between spending sufficiently and in the right people areas, so you can attract, retain and motivate the best talent to be productive and grow revenue, whilst protecting the company from excessive costs. With Ravio, this finally becomes possible.”

Silke Genenger
Head of Rewards at Storio Group
Ravio brings those analyses into one place, combining your employee data and salary bands with continuously updated market benchmarks so you can identify underpaid employees, band outliers, and potential attrition risks.
Compensation can influence how fairly employees feel their contribution is recognised, but higher pay doesn’t automatically improve performance. Tools like Ravio enable you to review pay alongside performance ratings to see whether higher performers generally progress further through their salary bands and identify cases where an employee’s performance and pay positioning appear out of step.
Look for experienced employees clustering near the bottom of their salary bands, comparable employees sitting far apart, or new hires positioned above longer-tenured employees – to reveal pay progression, compression, or consistency issues that may contribute to retention risk. Tools like Ravio enable you to easily visualise and analyse these patterns.
Retention compensation is additional financial compensation offered specifically to encourage an employee to stay with an organisation, often for a defined period or during a critical business event. Examples include retention bonuses, additional equity, or other financial incentives. It differs from proactively maintaining competitive base salaries to reduce broader retention risk.
A low compa-ratio alone doesn’t mean an employee is more likely to leave. Employees may sit lower in a range for legitimate reasons, including experience or performance. Look for whether lower compa-ratios repeatedly coincide with higher voluntary turnover among comparable employees, alongside other signals such as below-market pay or pay compression.
Compare voluntary turnover rates across compa-ratio ranges, such as employees below, near, and above the midpoint of their salary bands. Then segment the results by comparable roles, levels, or locations. Tools like Ravio help you to visualise and automate this process. This helps you identify whether employees positioned lower within their ranges consistently leave at higher rates than comparable colleagues.
Combine multiple signals rather than relying on one metric. Show whether voluntary departures citing pay cluster within particular roles, whether those employees sit below market or lower in their salary bands, and whether market data shows similar pay pressure. Together, these patterns build a stronger evidence base for targeted compensation adjustments.
Not necessarily. Blanket salary increases can raise costs without addressing the employees or roles where compensation is actually creating retention risk. First, identify below-market pay, unexplained differences between comparable employees, pay compression, and problematic band positioning. Then, prioritise targeted adjustments where the compensation data indicates a genuine gap.
Don’t rely solely on annual benchmarking. Market pay can move between compensation reviews, leaving employee salaries behind current rates before your next cycle. Monitor current market benchmarks throughout the year using a real-time benchmarking tool like Ravio, particularly for fast-moving or hard-to-hire roles, and use emerging gaps to determine when a market adjustment may be necessary.
Your monthly dose of market insights and expert perspectives
When do companies make their first Reward hire, and how fast does the team grow? Ravio data on total rewards team structure, from first hire to team of five.

Engineering talent doesn't come cheap, and the market moves fast. Join Ravio to see how leading companies are building competitive packages that actually hold up.

Radford compensation data is credible but often outdated, manual, and expensive. Compare the 12 best Radford alternatives for compensation benchmarking in 2026.

