FAQs
A salary benchmarking tool gives you data on market-typical pay for specific roles, levels, and locations – so you can make informed, competitive, and defensible pay decisions. Tools range from free salary calculators to purpose-built platforms with HRIS integrations, built-in compensation management, and total rewards data.
The best salary benchmarking tool meets your organisational needs. Typically this means integrating with your HRIS systems and offering real-time salary and total rewards data. It should also offer strong data coverage tailored to your needs, whether that's regional benchmarks or global market data, depending on your team's structure and hiring footprint.
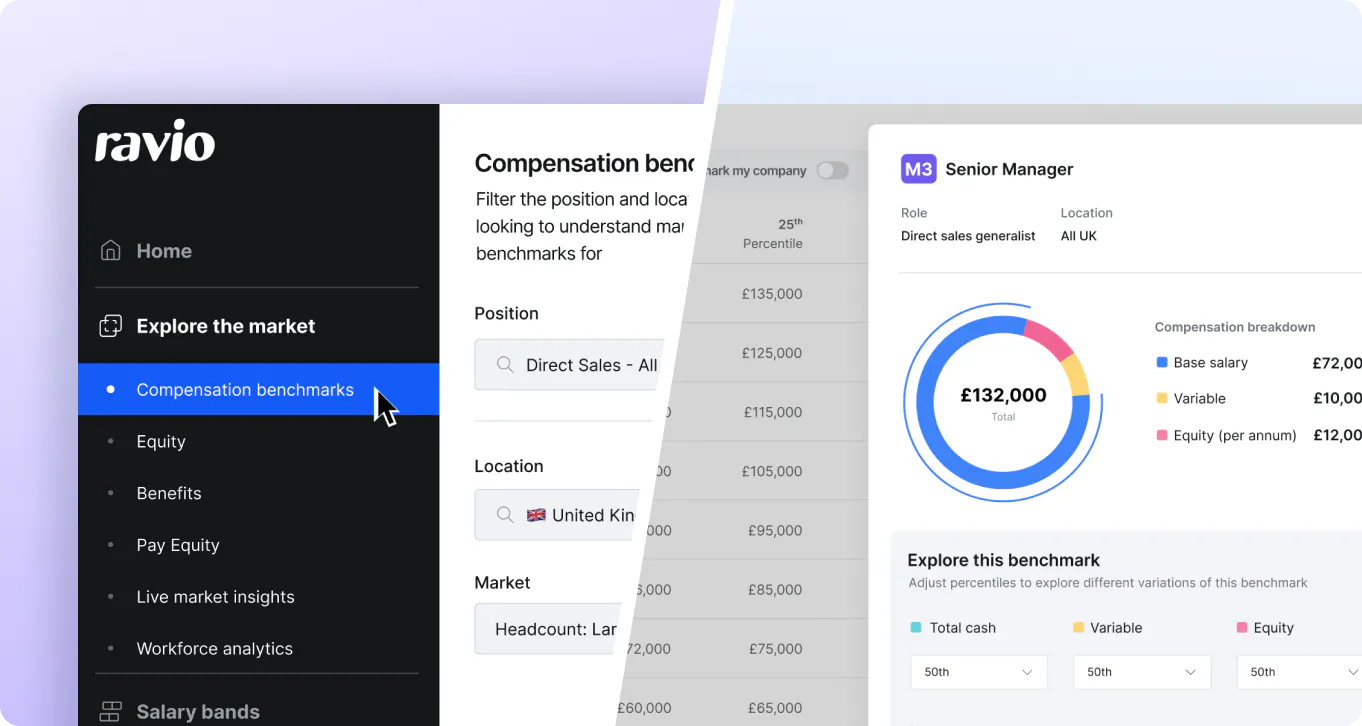
For high-growth and tech companies Ravio is the strongest option. It pulls live data from 1,500+ companies via HRIS integrations, covers 50+ countries and 300+ roles, and includes total rewards benchmarks across salary, equity, variable pay, and benefits. Benchmarks are validated monthly by a team of data scientists, so you're working from data you can actually defend.
Check how the tool collects and verifies data, and whether its coverage best fits your needs (regional vs global). Ensure it integrates with your HRIS system, is intuitive for team-wide adoption, and offers strong security standards – SOC 2 Type 2 certification and GDPR compliance for European data.
Start by checking whether the data actually covers your organisation – the roles, locations, and peer group you need. Then evaluate the data source and methodology to assess whether benchmarks are reliable enough to defend internally. Finally, consider whether the platform supports how you use benchmarks day-to-day – user permissions, compensation tools, and onboarding support all matter. Testing benchmarks before committing is the most reliable way to assess fit – Ravio offers three free benchmarks for any role, level, and location.
For companies hiring across the UK and Europe, Ravio covers both with reliable HRIS-integrated benchmarks and filters by location, industry, and company stage. Brightmine and Croner Reward are other UK-focused providers, but both are traditional employer-reported salary surveys, which come with limitations of outdated data prone to human submission error.
Why is salary benchmarking important?
Without reliable market data, compensation decisions become inconsistent – leading to overpaying, underpaying, pay equity issues, and difficulty retaining or attracting talent. Benchmarking gives you the foundation for fair, competitive, and defensible pay across your organisation.
How to conduct salary benchmarking?
Start by identifying the roles and locations you need data for, then choose a benchmarking tool that covers your peer group. Map your internal roles to the tool's framework to ensure like-for-like comparisons, set your target percentile in line with your compensation philosophy, and use the benchmarks to build or refresh salary bands. Revisit at least annually – or more frequently if you're in a fast-moving market.