For instance, in this example set of salary bands for UK Software Engineering we can see that the compa ratio for women in P3 and P4 is a fair amount lower than for men – which could be worth investigating.
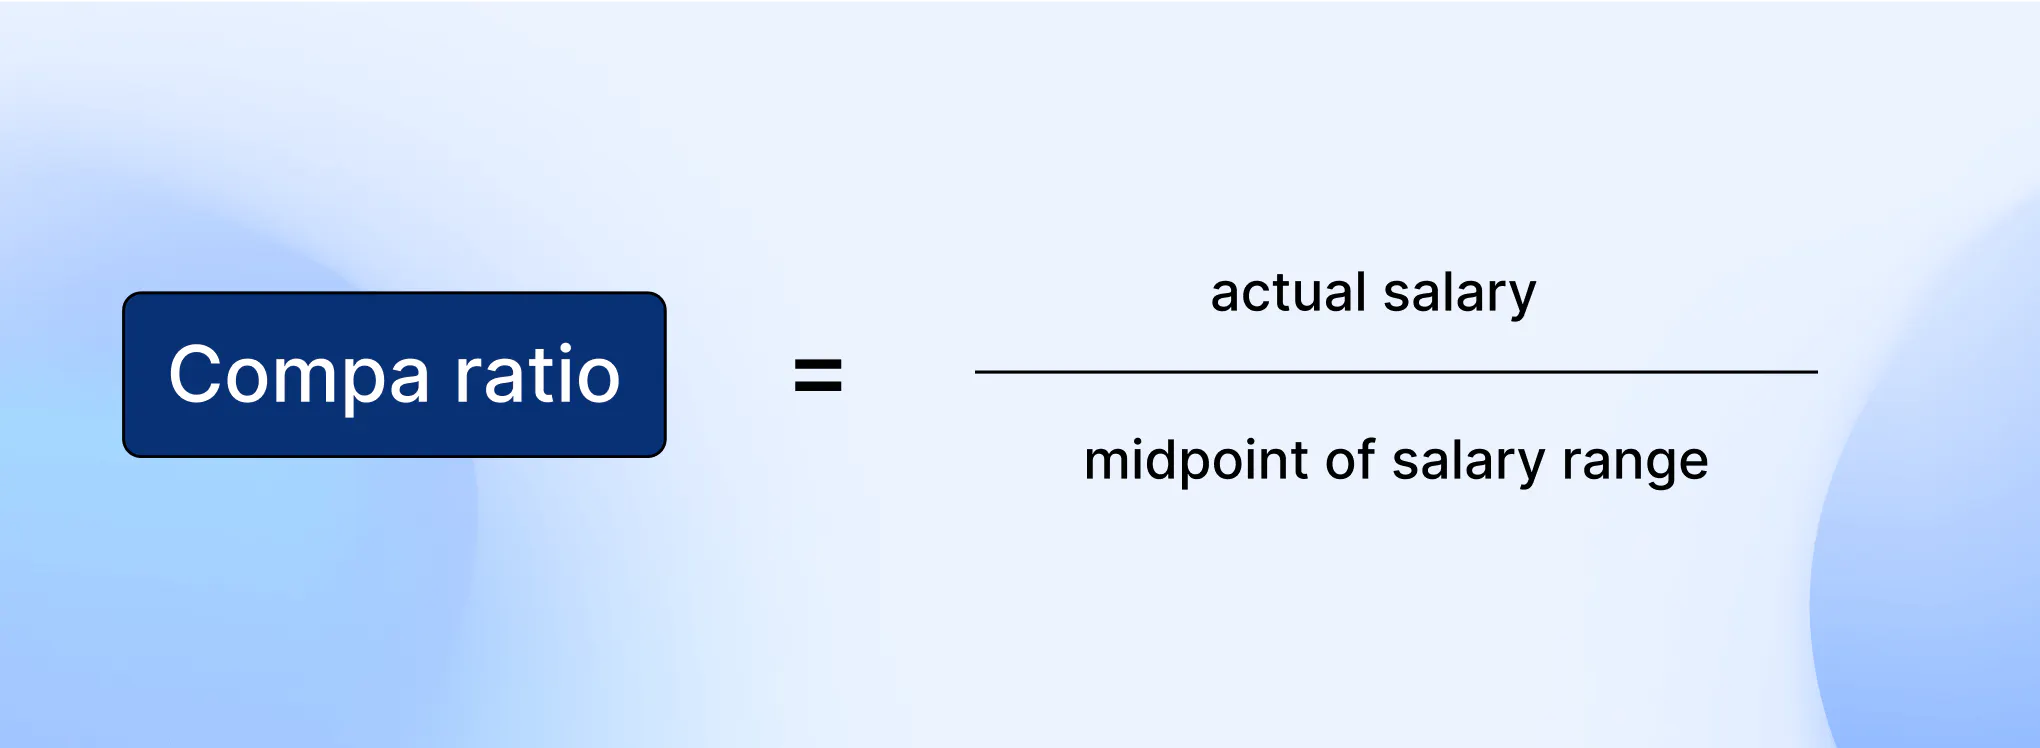
Further, because the compa ratio compares employee pay to the band midpoint, it’s also a useful metric for understanding market competitiveness during a compensation review too.
One of the first steps in any best practice compensation review process is to refresh the underlying salary benchmarking data that is used to inform the salary band midpoint – for the company targeting the market median, they will have used benchmarking data to understand what the market median is for each salary band in their structure.
Once the salary bands are refreshed, the compa ratio can then be used to see how employees compare to the new market normal.
It might be the case that typical salaries for a particular role, department, or location have shifted significantly since the salary bands were last refreshed – in which case you’ll notice that the compa ratio for many individual employees has dropped.
This is a clear indication that market adjustments are needed during the compensation review to ensure that the salaries of these employees are brought back in line with the market, to avoid attrition issues.
Many companies use a merit matrix to combine the compa ratio with employee performance ratings during compensation review, to determine the salary increase that each employee should receive.