
How Ravio builds benchmarks
Every benchmark in Ravio goes through the same careful process, from data collection to human sign-off. This page explains that process: what we do, why we do it, and where we're confident versus where we're cautious.
- Compensation datapoints
- 618,000+
- Companies in the dataset
- 1,800+
- Countries covered
- 50
- HR systems supported
- 80+
01 · Our philosophy
Three principles behind every benchmark
We believe a benchmark you can't explain is a benchmark you can't use. Everything on this page explains how we hold ourselves to these three principles.
Benchmarks should be ready-to-use
Free of level gaps and unexplained outliers, mapped to your employees, and ready to build into your compensation strategy.
Something isn't always better than nothing
If the underlying data doesn't meet our quality bar, we don't publish the benchmark.
Human review on every benchmark
Statistical checks only get you so far. Human expertise in compensation and local market trends closes the gap. Ravio benchmarks don't go live without both.
02 · Where the data comes from
Every datapoint comes from an HR system
All of Ravio's benchmark data comes from a single source: our participants.
When a company joins Ravio, they connect one or more of their HR systems – HiBob, Personio, BambooHR, or one of the 80+ integrations we support – and we pull their compensation data directly. The data reflects what employers actually pay today, not what employees self-report in a survey or what appears in unverified job postings.
The vast majority of our data arrives through live integrations. The remainder comes from customers who upload manually – normally because they use a system we don't yet support. Manual uploads are refreshed every 90 days to keep our data current. Either way, it's verified employer-held payroll data.
- compensation datapoints
- 618,000+
- companies in the dataset
- 1,800+
- of the dataset sits in our top five markets
- 57%
Our data comes from global tech businesses hiring across dozens of markets, and every one of them strengthens the dataset. That means our benchmarks go deep in every market we cover, not just one.
Share of compensation datapoints by country
| United Kingdom | 21% |
|---|---|
| Germany | 14% |
| United States | 8% |
| France | 7% |
| Netherlands | 7% |
| Rest of the world | 43% |
Why HR system data is the most reliable
Self-reported data – the kind used by Glassdoor, LinkedIn Salary, and traditional surveys – has two structural problems: it's unverifiable, and it's a fixed point in time, meaning it goes stale.
| Self-reported data | Ravio integrations | |
|---|---|---|
| Where it comes from | Individual employees contributing to platforms like Glassdoor or LinkedIn Salary or participant contributions to legacy surveys via spreadsheets. | Directly from employer HR systems such as HRIS, ATS, and EMS platforms. |
| How reliable it is | Unverified – susceptible to bias due to low-quality employee submissions or practitioner inconsistency as well as manual typos and mislabelling of data. | Considered the gold-standard in Reward benchmarking. Our verified compensation data, directly from employer systems of record. |
| How current it is | Traditional surveys: annual cycles, often 6–18 months old by the time they're published.Glassdoor et al: no date filtering – an average of every submission ever collected. | Underlying data is refreshed daily via live integrations with benchmarks published on a monthly cadence. |
03 · Levelling and mapping
How we label every datapoint
A compensation figure is only meaningful if you know exactly what role and level it belongs to. Ravio's taxonomy covers more than 700 distinct roles, and every datapoint we receive is labelled through the same three steps.
Automated matching
Our model maps and levels every employee record against Ravio's job catalogue and levelling framework.
Expert review
Our in-house Benchmarking Operations (BOps) team reviews those matches for consistency and accuracy, applying expert judgement where titles are ambiguous, roles are niche, or functions are hybrid.
Customer review
Our mapping and levelling arrive ready-to-use. You can fine-tune them in Ravio to reflect the nuances of your team as needed.
04 · Why we use a model
Why pure sample data isn't enough
Ask any provider how many datapoints they have and you'll get a number. It's a fair question, but an incomplete one. Traditional providers publish sample benchmarks: the raw distribution of their sample, cell by cell, as long as that cell meets a minimum publishing threshold. That approach has three main flaws.
It breaks obvious rules
When samples get thin, they skew too much based on the participants who have submitted data. So, sample benchmarks can start breaking fundamental progressions – e.g. a mid-level IC might be paid more than a senior one, which isn't market reality.
It's full of gaps
No dataset covers every level of every role in every market. Therefore sample benchmarks leave these gaps as blank cells. These are left to the end user to fill themselves. This goes against our ready-to-use principle.
It moves unpredictably
Thin coverage makes benchmarks jump over time. One company joining or leaving the dataset can shift a benchmark materially, so the market looks like it moved when only the sample did.
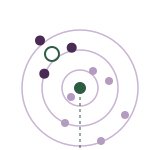
Ravio takes a different approach. Instead of reflecting the raw sample, our model reconstructs the true market median from every piece of evidence we hold – staying close to sample data where we believe it's strong (more on this in the next section), and extrapolating carefully where it isn't.
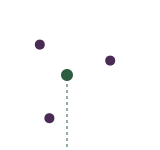
Imagine darts thrown at a target you can't see. From where they land, you work out where the centre is. Every benchmarking provider does this, estimating what they believe to be the market median from the data they collect. The difference is how.
Step 1 · Sampled approach
Step 2 · Modelled approach

Step 3 · Model locates the target
How the model works
Our model learns how pay relates to the factors that drive it: role, level, location, company size, and funding stage. It then produces a median estimate for every role, level, and market we cover. Where we have dense, high-quality sample data, the model stays close to it. Where data thins, the model extrapolates carefully using what it knows about similar roles, adjacent levels, and comparable markets.
Within a career track in Ravio's levelling framework, a P5 should earn more than a P4, which should earn more than a P3. If a benchmark breaks this progression, we don't publish it.
For Finance Systems at P3 in Germany, our pure sample data returned €91,200 – above the P4 median of €87,000, breaking level progression. So which figure is wrong? The P3 sample is small and comes mostly from large companies, which pay more – so it's inflated. The P4 sample draws on more companies across a range of funding stages, so it better reflects the market. That's why the model corrects P3, not P4: it brought P3 down to €72,500, in line with the broader market picture for this role family.
P3 → P4: −€4,200 (−4.6%) · pay cut on promotion
P3 → P4: +€14,500 (+20.0%) · progression restored
“However large a benchmark's sample is, it can only tell you about the data it contains. A model gets us from the sample we hold to the market it's meant to reflect.”

05 · The sample trust score
When to trust the sample data
A model is complete and logically consistent, but it's a generalisation – it can smooth over a real local signal that a rich sample would catch. So for every benchmark we calculate a sample trust score: how far the final number should move from the model towards the raw sample.
Sometimes the sample for a specific level, role, or region isn't reliable enough to act on – and so the model output stands. Other times we are very confident that our sample is diverse and representative so we align our benchmark to the sample data. But how do we determine what is a strong sample?
Three things earn a high sample trust score:
Volume
We count contributing companies, not headcount. 100 employees from one firm is less reliable evidence than 20 employees from eight firms.
Level consistency
Strong, logical level progression earns full weight. Weak or inverted progression reduces the trust score moving the benchmark towards the modelled benchmark.
Stability
To test stability, we recalculate the benchmark several times, leaving out one contributing company each time. If the benchmark barely moves, it's representative of the whole sample. If it moves significantly, a single company is skewing it.
“Size of sample on its own doesn't reflect the quality of a benchmark. Even a small sample can produce reliable benchmarks, if it's diverse, internally coherent, and stable.”

06 · Confidence indicators
How we measure confidence: track and distance
Every benchmark carries a confidence indicator. It reflects two things: how well-covered that type of benchmark is in our dataset, and how far the specific benchmark sits from the nearest region of strong data.
We aim to release reliable benchmarks as early as possible, so a large share of what we publish sits in the Calculated tier. For established, high-demand roles such as software engineering, most benchmarks sit at the Very strong end. The bar is deliberately high – just 11.3% of benchmarks earn Very strong – because a confidence label is only useful if it's rigorous.
| Very strong | 11.3% |
|---|---|
| Strong | 12.3% |
| Moderate | 16.0% |
| Calculated | 60.4% |
The spread depends on the strength of our data in each market. Here's the same breakdown for the UK, one of our established markets.
| Very strong | 41.8% |
|---|---|
| Strong | 23.7% |
| Moderate | 18.7% |
| Calculated | 15.8% |
- Very strong / Strong
- Built on dense data and a well-established track.
- Moderate
- Benchmark sits on a track with some dense data and some extrapolation.
- Calculated
- Meets our minimum publishing threshold – at least 12 datapoints from seven distinct companies per track.
- Not published
- Benchmarks below our minimum publishing threshold are not published.
07 · Core benchmarks and differentials
Two families of benchmark, both clearly labelled
Core benchmarks are built directly from our own sample data. Every confidence tier above applies to them.
Differentials extend coverage into markets where our direct sample is thin, using pay ratios between an anchor market (where our data is strong) and the target market. They let us release reliable benchmarks as early as possible, rather than waiting for sample data to build up.
| 94% core | 94% |
|---|---|
| 6% differentials | 6% |
Share of all published benchmarks. We label both types clearly in the platform.
What sets our differentials apart
Built from employee-level data
We calculate each ratio from the individual employee records behind our benchmarks, not from published medians. That's something you can't reproduce yourself from public figures or another provider's outputs.
Many ratios, not one
Other providers typically convert one anchor market's data into every other country using a single fixed ratio. We calculate separate ratios by role and function, because the pay gap between two markets isn’t the same for an engineer as it is for a salesperson.
Best-fit anchor market
Rather than routing every country through one fixed anchor, our model chooses the anchor market that best fits each target market, so each differential starts from the closest comparable data.
08 · Quality assurance (QA)
Statistical checks, then human review
Every benchmark clears three statistical checks, then an expert reviewer makes the final call – including whether to publish at all.
Distance from sample
We analyse each benchmark: both the model output and the underlying sample. Unexplained divergence is investigated. This highlights when the model may be stretching too far, or an unusual cluster of companies may have skewed the benchmark.
Internal consistency
We check that level progressions hold within role families, that roll-up benchmarks don't contradict the ones they aggregate, and that cross-family relationships make sense.
Spread of the data
We check how widely the underlying pay data is distributed for each benchmark. An unusually wide or lopsided spread can point to mixed-up roles or levels, or a few outliers pulling the figure, so we investigate before it goes live.
A member of our QA team checks the outputs and applies local market knowledge. We factor that context in before publishing anything. If a benchmark is showing something we can't explain, we don't publish the benchmark.
“Statistics can tell you a number is unusual. It takes someone who understands the market to know whether unusual means wrong.”

09 · Common objections
Questions we hear a lot
“How many datapoints do you have?”
618,000+ from 1,800+ companies across 50 countries. But volume is only one factor. What matters is whether the data is verified, consistently labelled, and handled honestly where it's thin. That's what our methodology is built around.
“You're modelling the data – isn't that just making it up?”
Every provider chooses how close to stay to raw sample versus how much to smooth and fill. Ravio makes that choice deliberately and shows you the result through confidence indicators and a transparent methodology. If you stay too close to raw sample, you get noisy benchmarks that break basic common sense. Move too far from the sample and you get tidy numbers with no grounding in reality. We're confident our approach gives customers the most accurate picture of the market – see why we use a model.
“What if you don't have data for our role or market?”
We produce differential benchmarks, calculated from pay ratios at the role and function level across our anchor markets. We fill gaps with principled estimates and label them clearly. Below our minimum confidence threshold, we don't publish.
“What exactly do you benchmark?”
Base salary, variable pay, OTE and equity, from the 10th to the 90th percentile. You can filter by role, level, location, company size and funding stage, with every level defined by the Ravio level framework. Explore our benchmarks to see what's available for your roles and markets.
“How do I know the data is current?”
Our data arrives through live HR system integrations. Traditional survey data is often 6-18 months old by the time it reaches you. We use live integrations with your HR system to build a view of what the market is paying today.
Ravio
Put a defensible number behind every pay decision
Every benchmark in Ravio has been through the process on this page. Search our live market data and see what the market is actually paying – your first three benchmarks are free.
Benchmarking methodology · Ravio

