New3x the coverage, same rigorous quality. 300 positions benchmarkedExplore

Reliable compensation benchmarks: How Ravio produces benchmarks you can count on

BenchmarkingRavio updates

You’d think that having hundreds of datapoints behind a benchmark makes it reliable.

In reality, sample size alone doesn’t make data relevant to your specific company.

Consider, for example, a Berlin-based Series B fintech benchmarking pay against a ‘tech’ dataset that’s actually built mostly from US enterprises or early-stage bootstrapped startups. 

On paper, these numbers look robust. In practice, they barely align with your industry, location, headcount, or funding stage.

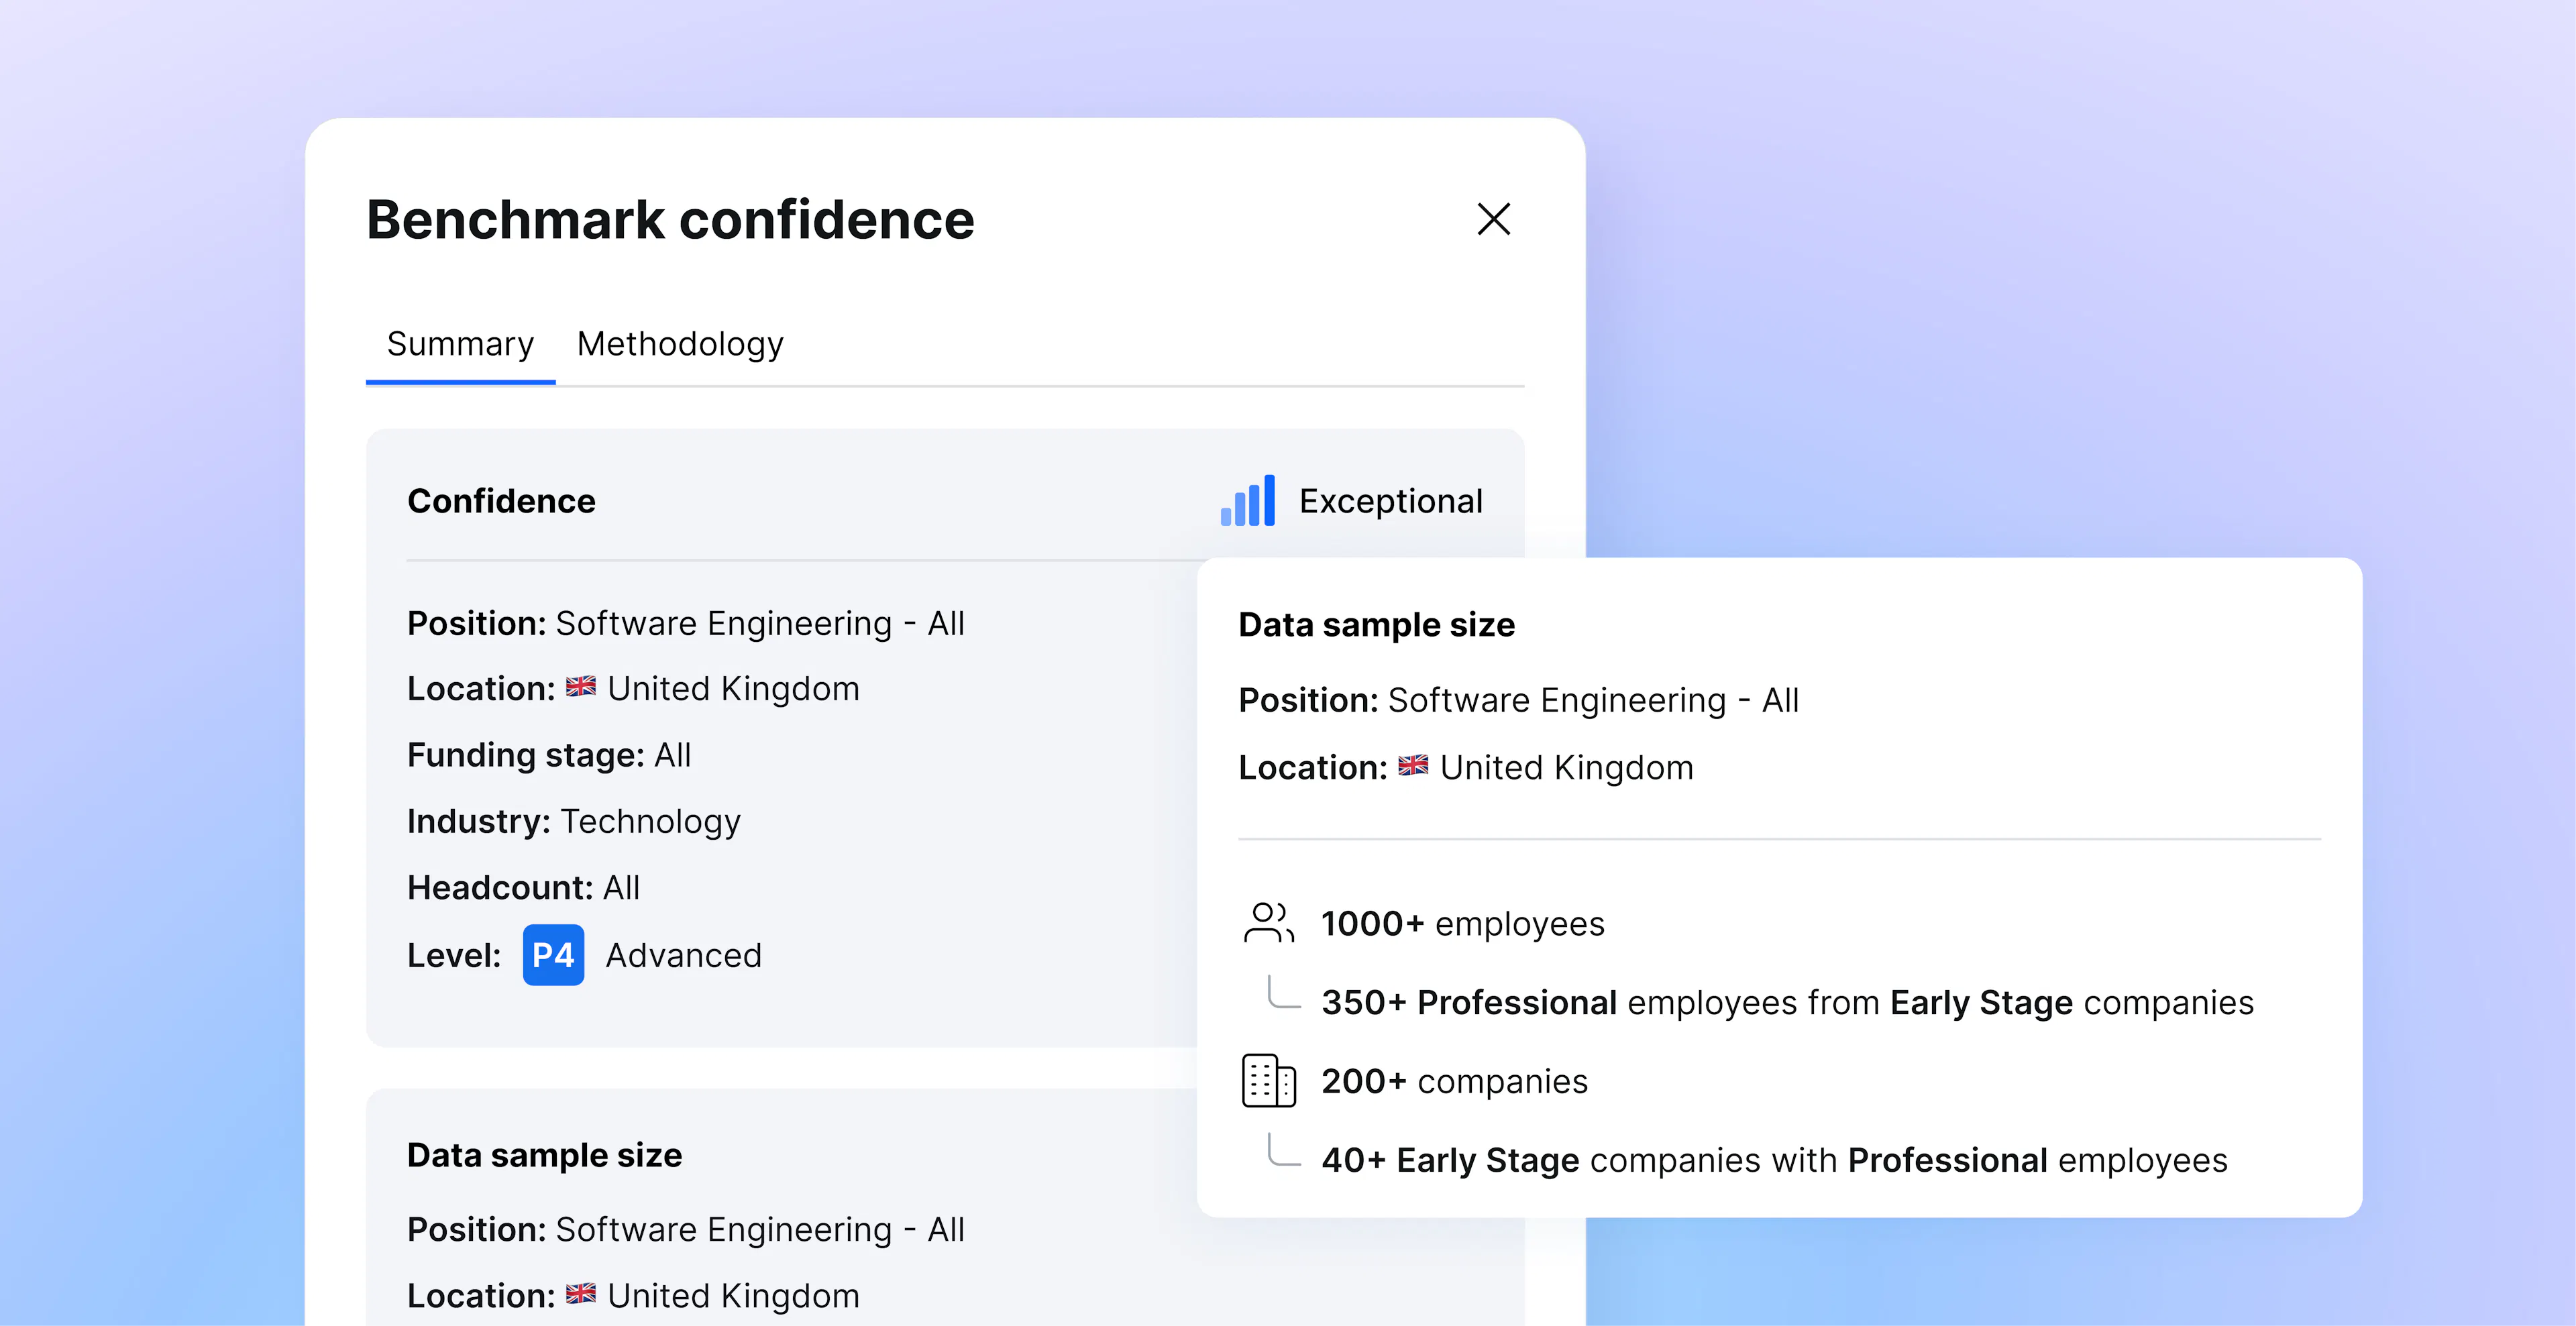
That’s why the better question isn’t, “How much data do you have for this role?” alone, it’s:

  • Where does the data come from?
  • How is it validated and kept up to date?
  • And how relevant is it to companies like ours?

Without clear answers, even large datasets can produce misleading benchmarks – particularly when inputs aren’t recent, standardised, or truly comparable.

And because compensation decisions shape retention, pay equity, and compliance, “close enough” simply isn’t good enough. 

When you’re setting salary bands, responding to counter-offers, or reviewing pay gaps, you need benchmarks you can explain and defend.

That’s exactly why People and Rewards teams frequently ask us these questions – because they know trusting benchmarks isn’t about volume, it’s about defensibility.

So in this guide, we’ll walk you through how Ravio approaches data collection, validation, and ongoing accuracy – and turns raw data into usable benchmarks you can actually trust and apply. 

TL;DR – key takeaways: 

  • A large dataset doesn’t automatically make a benchmark trustworthy – relevance, statistical validation, and usability matter just as much.
  • Ravio sources live compensation data directly from HRIS integrations, with a human data science team verifying and using it to build statistically validated benchmarks mapped to a consistent job architecture (level framework and job catalogue).
  • The result is decision-ready benchmarks (not raw data that you have to map yourself) so you can set salaries, respond to counter-offers, and defend pay decisions with confidence.

First things first: What makes a reliable compensation benchmark? 

Reliable compensation benchmarks aren’t defined by how much data sits behind them but by how the data is collected, validated, and delivered to you. Meaning, the three pillars making up a reliable benchmark are:

1. Data collection: Where does the data come from?
Is the data self-reported, sourced directly from integration with HR systems, or pieced together from multiple free salary data sources? How frequently is it refreshed? Reliable benchmarks start with traceable, error-free inputs that are regularly updated. 

2. Data validation: How is the data processed and verified?
How are outliers, duplicates, data gaps, and inconsistent job titles handled? Raw data alone isn’t a benchmark. It needs cleaning, standardisation, job mapping, and quality checks to ensure outliers, duplicates, and inconsistencies don’t distort results.

3. Benchmark delivery: How are insights presented and filtered?
Is the data delivered raw, or verified and used to build instantly usable benchmarks? Can you filter the benchmarks by location, funding stage, industry, or company size? Can you see how recent and statistically robust the dataset is? Even high-quality market data can mislead if it isn’t segmented and delivered in a way that makes it usable and relevant to your company.

When these three pillars are strong, you get real-time salary benchmarks that you know are relevant to your roles, location, and industry – so you’re making fair, competitive, and defensible pay decisions. 

Helpful to know: Compensation data isn’t the same as compensation benchmarks. 

Compensation data is the raw, unprocessed data on what individuals are paid – what we collect from you via your HRIS.

Compensation benchmarks are built by verifying that raw data, statistically validating it, and mapping it to roles and levels using a consistent methodology, so you get accurate, like-for-like market insights that you can use right away to make pay decisions. These benchmarks are what we deliver back to you in the Ravio platform. 

How is compensation data typically collected, validated, and delivered?

Different compensation benchmarking companies operate in fundamentally different ways – from how they gather data to how much the data is processed before being delivered to you as a benchmark, and how often both the data and resulting benchmark are refreshed.

So to help you make sense of those differences before we dig any deeper, here’s a side-by-side overview of how common salary data providers typically collect, validate, and deliver their benchmarks:

Compensation benchmark source

How data is typically collected

How data is typically validated

How data is usually delivered


Traditional salary survey providers (e.g. Mercer)  


Annual or biannual surveys sent to participating companies (usually large multinational organisations) – HR teams have to manually submit their data, painstakingly mapping internal roles and levels to the provider’s job codes.


Light level of data processing, but no publicly available data verification methodology in place for most providers. Also, data may be several months old by the time it’s published.


Aggregated raw data per job role available via spreadsheets or provider platforms. Teams need to map this data to their own job levels themselves. 


User-submitted sources (e.g. Glassdoor – this is where AI tools pull their data from too)


Self-reported, unverified salary submissions from employees via public platforms. Participation is voluntary and ongoing.


These platforms typically don’t have any data verification processes in place for how data is cleared, weighed, or kept up to date. Some may use automated checks for duplicates or extreme outliers, but data accuracy depends on user honesty and correct job classification.


Public dashboards with broad filters (e.g. job title, location). 


Governmental sources (e.g. ONS in the UK)


Employer-reported payroll data collected for compliance or taxation purposes. Updated periodically through official reporting cycles.


Validated for regulatory accuracy, but not standardised for granular job matching. Often aggregated into broad occupational categories.


Public datasets or reports. Data is highly aggregated, with limited segmentation by seniority, funding stage, or industry.


Real-time compensation benchmark providers (e.g. Ravio)


Direct integrations with HRIS or payroll systems, enabling ongoing data feeds from participating companies.


Automated or human-led data cleaning, standardisation, and job mapping (depending on the provider). 


Interactive platforms with real-time filtering by location, company size, industry, and other variables. Benchmarks are refreshed more frequently. 

This context matters. 

When you understand how benchmarks are made, validated, and delivered, you can better judge whether they qualify as reliable compensation benchmarks

With that, let’s look at how Ravio approaches each of these pillars in practice:

How does Ravio collect compensation data?  

Ravio sources global base salary, variable pay, equity, and employee benefits data directly from 1,500+ live integrations with HRIS and ATS of participating companies. 

Unlike free or traditional salary data sources relying on self-reported or retrospective manual submissions – often resulting in outdated or error-prone insights – these live integrations ensure data is: 

  • Pulled directly from payroll and HR systems of record – reducing the risk of manual entry errors, inconsistent job titles, or outdated submissions
  • Continuously updated as compensation changes occur – providing real-time data rather than periodic snapshots collected once or twice a year.

Plus, Ravio uses a team of data scientists to verify its HRIS-sourced compensation data for accuracy and consistency across industries and roles, and to map that data to our level framework and job catalogue (more on job mapping below). If you don’t have a formal level framework in place, you can always adopt Ravio’s structure – as many early-stage teams do.

With data sourced from 500,000+ individual employee datapoints, benchmarks are then built on statistically meaningful samples, not isolated submissions.

Ravio's sample size indicators

The result is that the benchmarks you get (more on this below) stand on current, representative, comparable data – improving their statistical reliability and the confidence you can place in them.

And because Ravio primarily integrates with high-growth tech companies, the dataset is also more targeted than what traditional salary survey data offers as participants typically include large multinational organisations with legacy job architectures.

For People and Rewards teams, that means salary benchmarking against market data that reflects how comparable companies are paying right now (not how they paid months ago). 

Take it from the team at FTAPI, a B2B SaaS scale-up in Germany that wanted benchmarks from companies similar to theirs. 

“We cannot compete with Google salaries, for example, so we needed to find a tool, with benchmarks comparable to our company,” their Head of People and Culture, Kim Heckner, shares. 

Ravio helped them with this:

"One of the reasons we chose Ravio was that they have benchmarks from a wide range of German companies, and transparently showed us a list of names from considered peer groups and companies that we wanted to be comparing against."

Kim Heckner

Kim Heckner

FTAPI

How does Ravio validate compensation data? 

To produce a benchmark, the team uses a rigorous methodology, processing all the raw compensation data received via HRIS integrations and reviewing outliers, removing stale records, and statistically validating the data.

Ravio also uses role-specific thresholds to make sure these benchmarks are only made available when there is sufficient statistically meaningful data for that specific role. For instance, a volatile newly emerging role requires more data for a confident analysis, than a stable existing role. If thresholds aren’t met, benchmarks are withheld rather than published with weak statistical backing.

This validation process is made visible in the transparent sample size, data source, and confidence indicator (‘exceptional,’ ‘very strong,’ ‘strong,’ ‘good,’ or ‘moderate’) you see with each benchmark:

Ravio's benchmark confidence indicators: See the sample size, confidence, and methodology for every compensation benchmark you rely on.

This differs significantly from other compensation data sources that generally lack transparent data verification methods.

Comparatively, Ravio’s validation model gives you benchmark confidence – data that reflects current market reality, helps you spot salary shifts earlier, and supports defensible pay decisions. 

“The numbers in the Ravio platform are more accurate to what we believe is our market,” as Evert Kraav, Senior Compensation Manager at Bolt puts it.

“We don’t have to worry about expired or old data or how we should age it. Those questions go out of the window now that we have Ravio.”

Evert Kraav, Senior Compensation Manager at Bolt

Evert Kraav

Bolt

All of this data validation and benchmark calculation is nuanced work that’s not possible to do well without human oversight. 

For that reason, we don’t rely solely on automated or AI-driven data validation. Purely AI-generated benchmarks can miss contextual nuances – such as evolving job architectures, local market nuances, or hybrid roles – that require human judgement.

How does Ravio deliver benchmarks?

Ravio delivers usable, total compensation benchmarks that are mapped between the Ravio level framework and your internal roles and levels during onboarding and accessible through an intuitive platform with granular filters and market trends visibility.  

Because our team of benchmarking experts has already aligned your roles to the same level framework and job catalogue we use within our compensation benchmarking data, the benchmarks you see in the platform are ready-to-apply to your internal reality. There’s also a correlation table that shows exactly how your internal levels align with Ravio’s.

Level mapping in Ravio

For each employee, you can also see their internal job title and level, and the Ravio job title and level they've been mapped to.

Ravio mapping per individual employee – see how your internal role and level matches up with Ravio's job catalogue and job level, for accurate, like-for-like insights

So when you benchmark a P3 engineer, you know it always corresponds to the same role and level in the market dataset, reducing the risk of misleading comparisons. 

This risk is common when you work with compensation survey data from traditional providers that you have to manually map against broad survey catalogues which often contain hundreds of predefined job titles. 

Benchmark access is also structured differently in Ravio. 

Traditional surveys typically require you to submit your compensation data before accessing results. 

This often involves time-consuming data formatting and inputting, followed by weeks of waiting for survey submissions to be aggregated and published and made accessible either via static spreadsheets or complex corporate-style portals.

With Ravio, access begins by integrating your HRIS/ATS as part of onboarding. 

Once onboarding is complete and we’ve mapped your roles and levels to our job architecture, benchmarks are instantly accessible within Ravio’s interactive platform that users describe as “a user-friendly benchmarking tool.” 

Plus, with user permissions covering all the different use cases for accessing comp benchmarks, it’s easy to get the rest of your team set up on Ravio too.

As Elisa H from Howspace put it:

“Ravio is a very easy to use compensation benchmark tool that – to a high degree – can be trusted to show real-time signals of a variety of countries and roles.”

- Elisa H, Howspace

With Ravio’s benchmarks you can: 

  • Review base salary, equity, variable compensation, benefits, total cash (base salary + variable), and total comp (base salary + variable + equity) for all roles, levels, and locations Ravio covers, all in one place. 
  • Apply filters by location, company size, industry, and other variables to refine your peer group comparisons. 
  • Access additional market trends and workforce analytics to stay on top of salary movement, hiring activity, and attrition patterns – and compare your workforce directly to market benchmarks.
Ravio workforce analytics: See the total compensation breakdown per employee, how that relates to your market target, and the cost-to-fix, all in one place

In short, Ravio’s delivery model reduces manual work while increasing benchmark usefulness. 

The result: comparable, decision-ready benchmarks that help you move faster without compromising accuracy.

Bringing it all together: Benchmarks you can defend, not just reference

Reliable compensation benchmarks come from how data is collected, validated, and delivered.

With Ravio, compensation data is pulled directly from live HRIS integrations – requiring no recurring manual submissions or job mapping. 

A human team of data scientists reviews all data monthly and converts it into benchmarks – statistically validating it, identifying outliers, and only publishing benchmarks when role-specific confidence thresholds are met.

So what you get are decision-ready compensation benchmarks you can explain internally: why the sample size is strong, how recent the data is, how roles were aligned, and why the comparison is relevant to your company.

For the team at Sastrify, this has meant less worrying about whether a benchmark reflects the market or is relevant to the right peer group. In turn, this has led to streamlined reviews and defensible compensation conversations with both leadership and individual employees.

“When discussing pay raises, we can show that our recommendations are backed by accurate benchmarks. This has built a strong level of trust with our senior leadership as well as our employees in our compensation strategy.”

Claudia Korenko

People Experience Specialist at Sastrify

Want to see how Ravio benchmarks compare for your roles at your organisation? Test three benchmarks for free and see how accurate the data is. 

Explore Ravio's benchmarks for yourself

FAQs

What makes salary benchmarking data reliable enough to make pay decisions?

Reliable salary benchmarking data comes from verified sources, is statistically validated, and reflects roles, companies, and locations comparable to yours. It should be built on structured data inputs – ideally live data via HRIS integrations rather than manual submissions – mapped to consistent job levels and supported by sufficient sample size for each role and market. Without these controls, benchmarks risk reflecting outdated, inconsistent, or irrelevant compensation data.

How does Ravio ensure benchmarks are reliable?

Ravio gives you accurate and up to date benchmarks by sourcing live compensation from HRIS integrations, validating it with a human team of data scientists who check for outliers and apply statistical thresholds before publishing results. These benchmarks are only available when sufficient sample size and confidence levels are met, ensuring comparisons are accurate, current, and relevant to your organisation.

Does Ravio require a give-to-get data submission model?

No, Ravio does not require manual data submissions to access benchmarks. Instead, companies connect their HRIS or ATS during onboarding, allowing compensation data to flow automatically. This removes manual data entry and job mapping common in salary survey models, giving teams faster access to benchmarks without manual data wrangling or waiting for survey results to be aggregated and shared. And, because it’s a live integration, the mapping and data submission only has to happen once, unlike with salary surveys where each survey needs a new submission.

How does Ravio handle job mapping and level alignment?

Ravio uses a team of benchmarking experts during onboarding to map your roles and levels to Ravio’s job level framework and job taxonomy. You get a correlation table showing how internal roles align with the market dataset. This ensures apples-to-apples comparisons and avoids mismatches that could skew salary bands, compensation reviews, or pay decisions you make.

Can I trust Ravio benchmarks for niche roles or smaller markets?

Yes, Ravio applies role-specific publishing thresholds to ensure benchmarks are only shown when statistically meaningful sample sizes exist. If sufficient data isn’t available for a role, location, or filter combination, benchmarks are withheld. This protects data quality, ensures compliance, and prevents decisions based on weak or incomplete market samples.

Get the Compensation Review straight to your inbox

Your monthly dose of market insights and expert perspectives

You might also like