If you can't explain where the number came from, that's when the second-guessing starts.
That's why we've enhanced how we show benchmark confidence in Ravio. We show our methodology for every benchmark, so you can stand by it.
Four confidence levels. One quality bar.
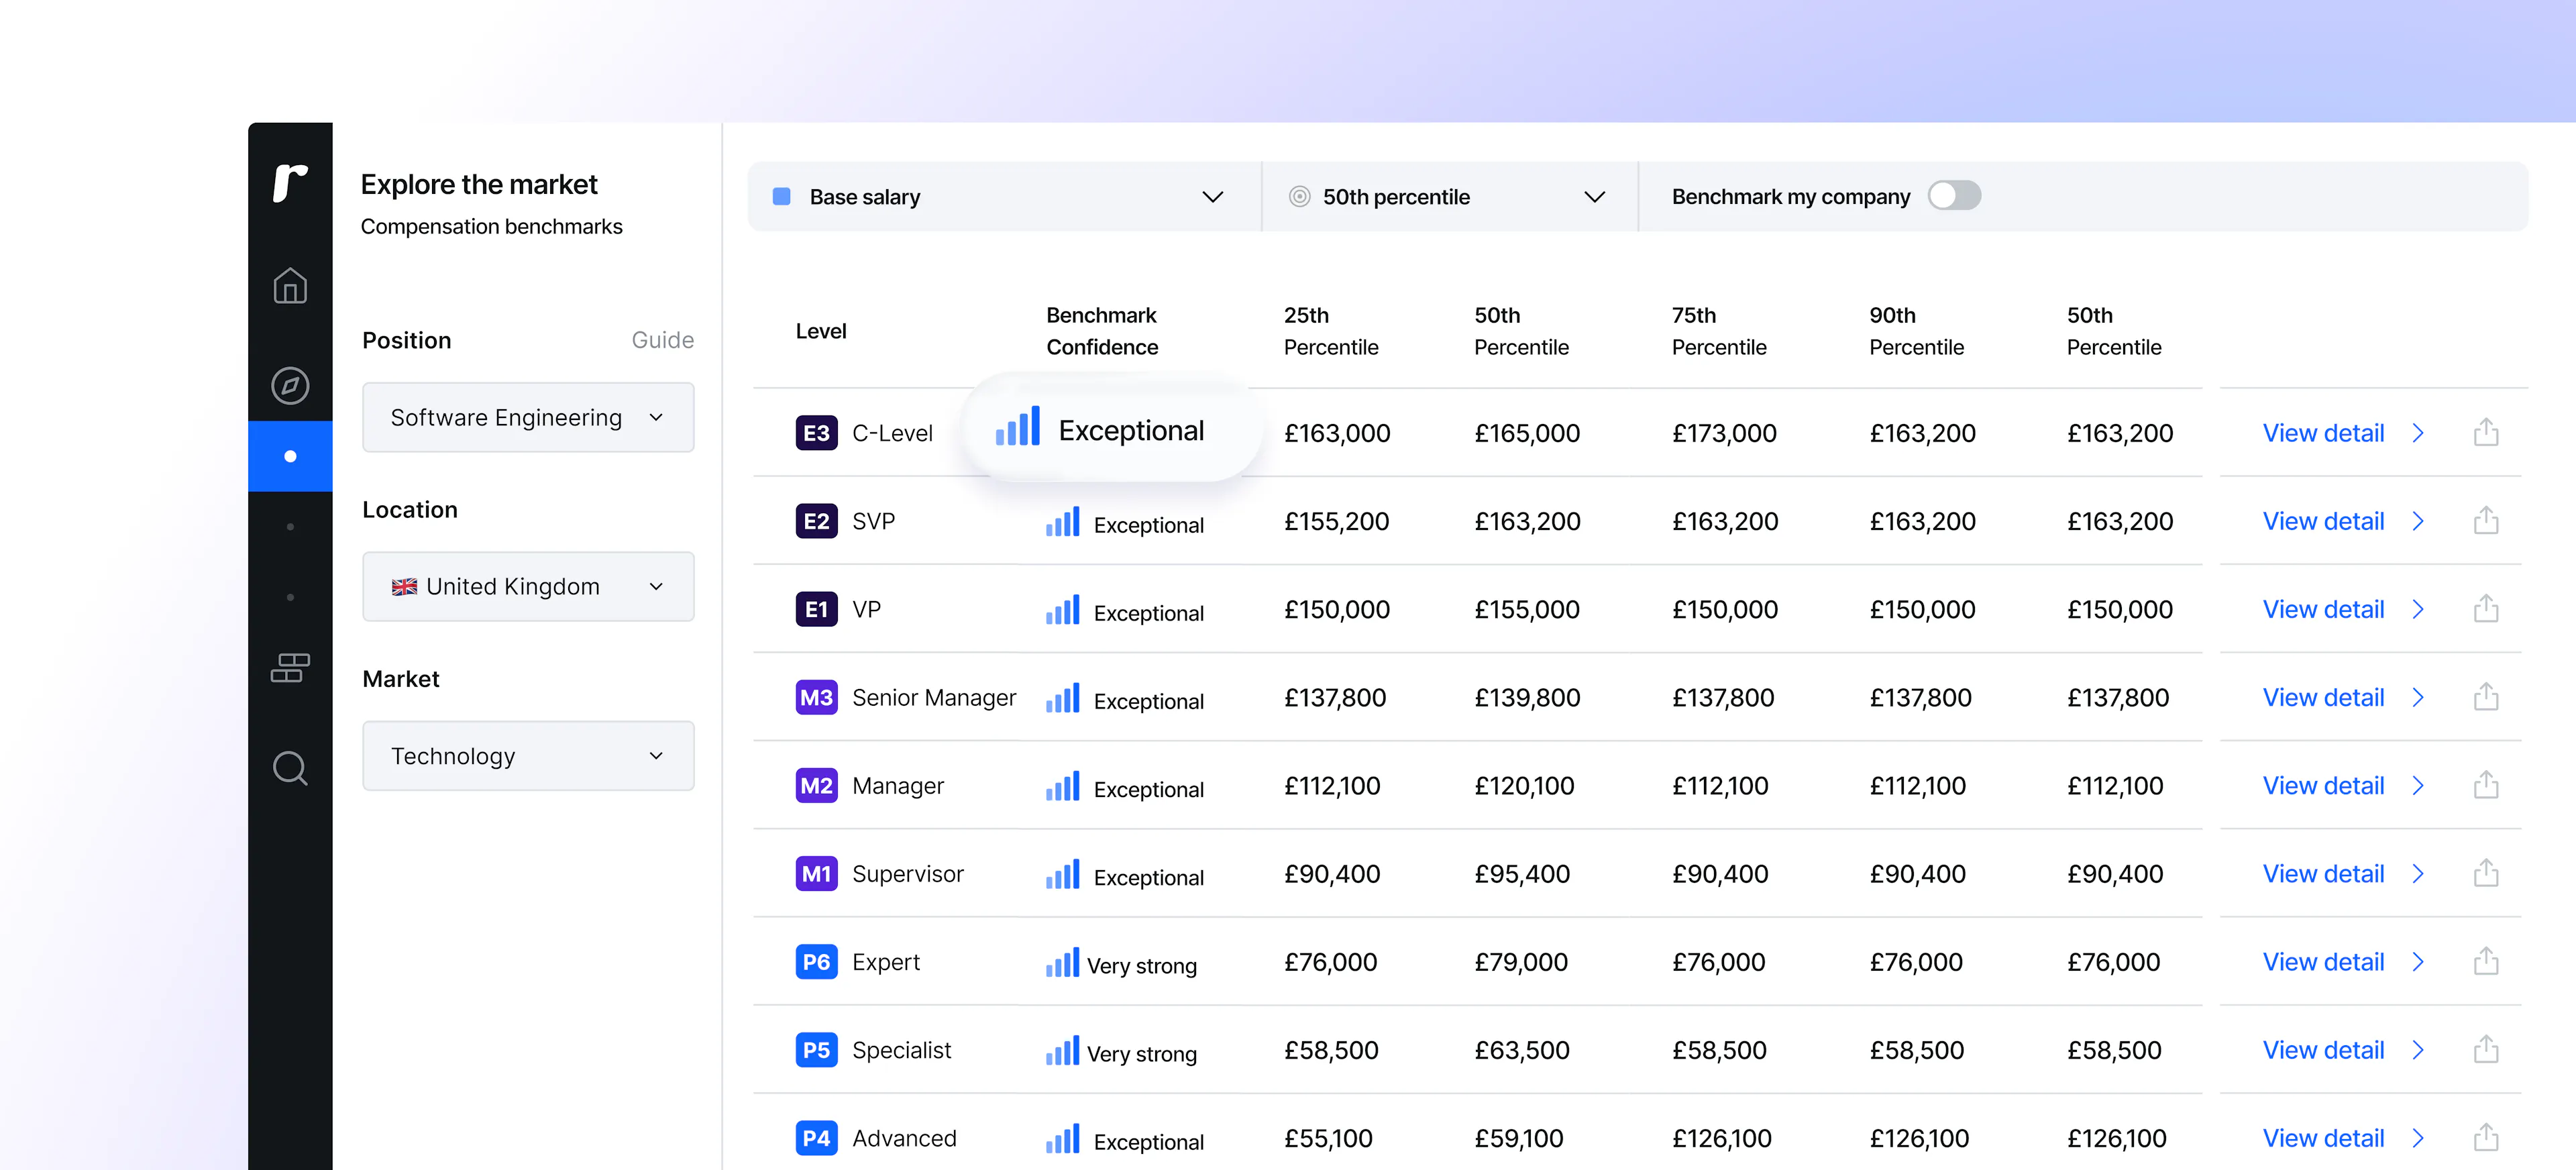
Every benchmark now carries a confidence indicator: Exceptional, Very Strong, Strong, or Moderate. Each reflects the size and diversity of the underlying dataset and the strength of the signal that data is giving us.
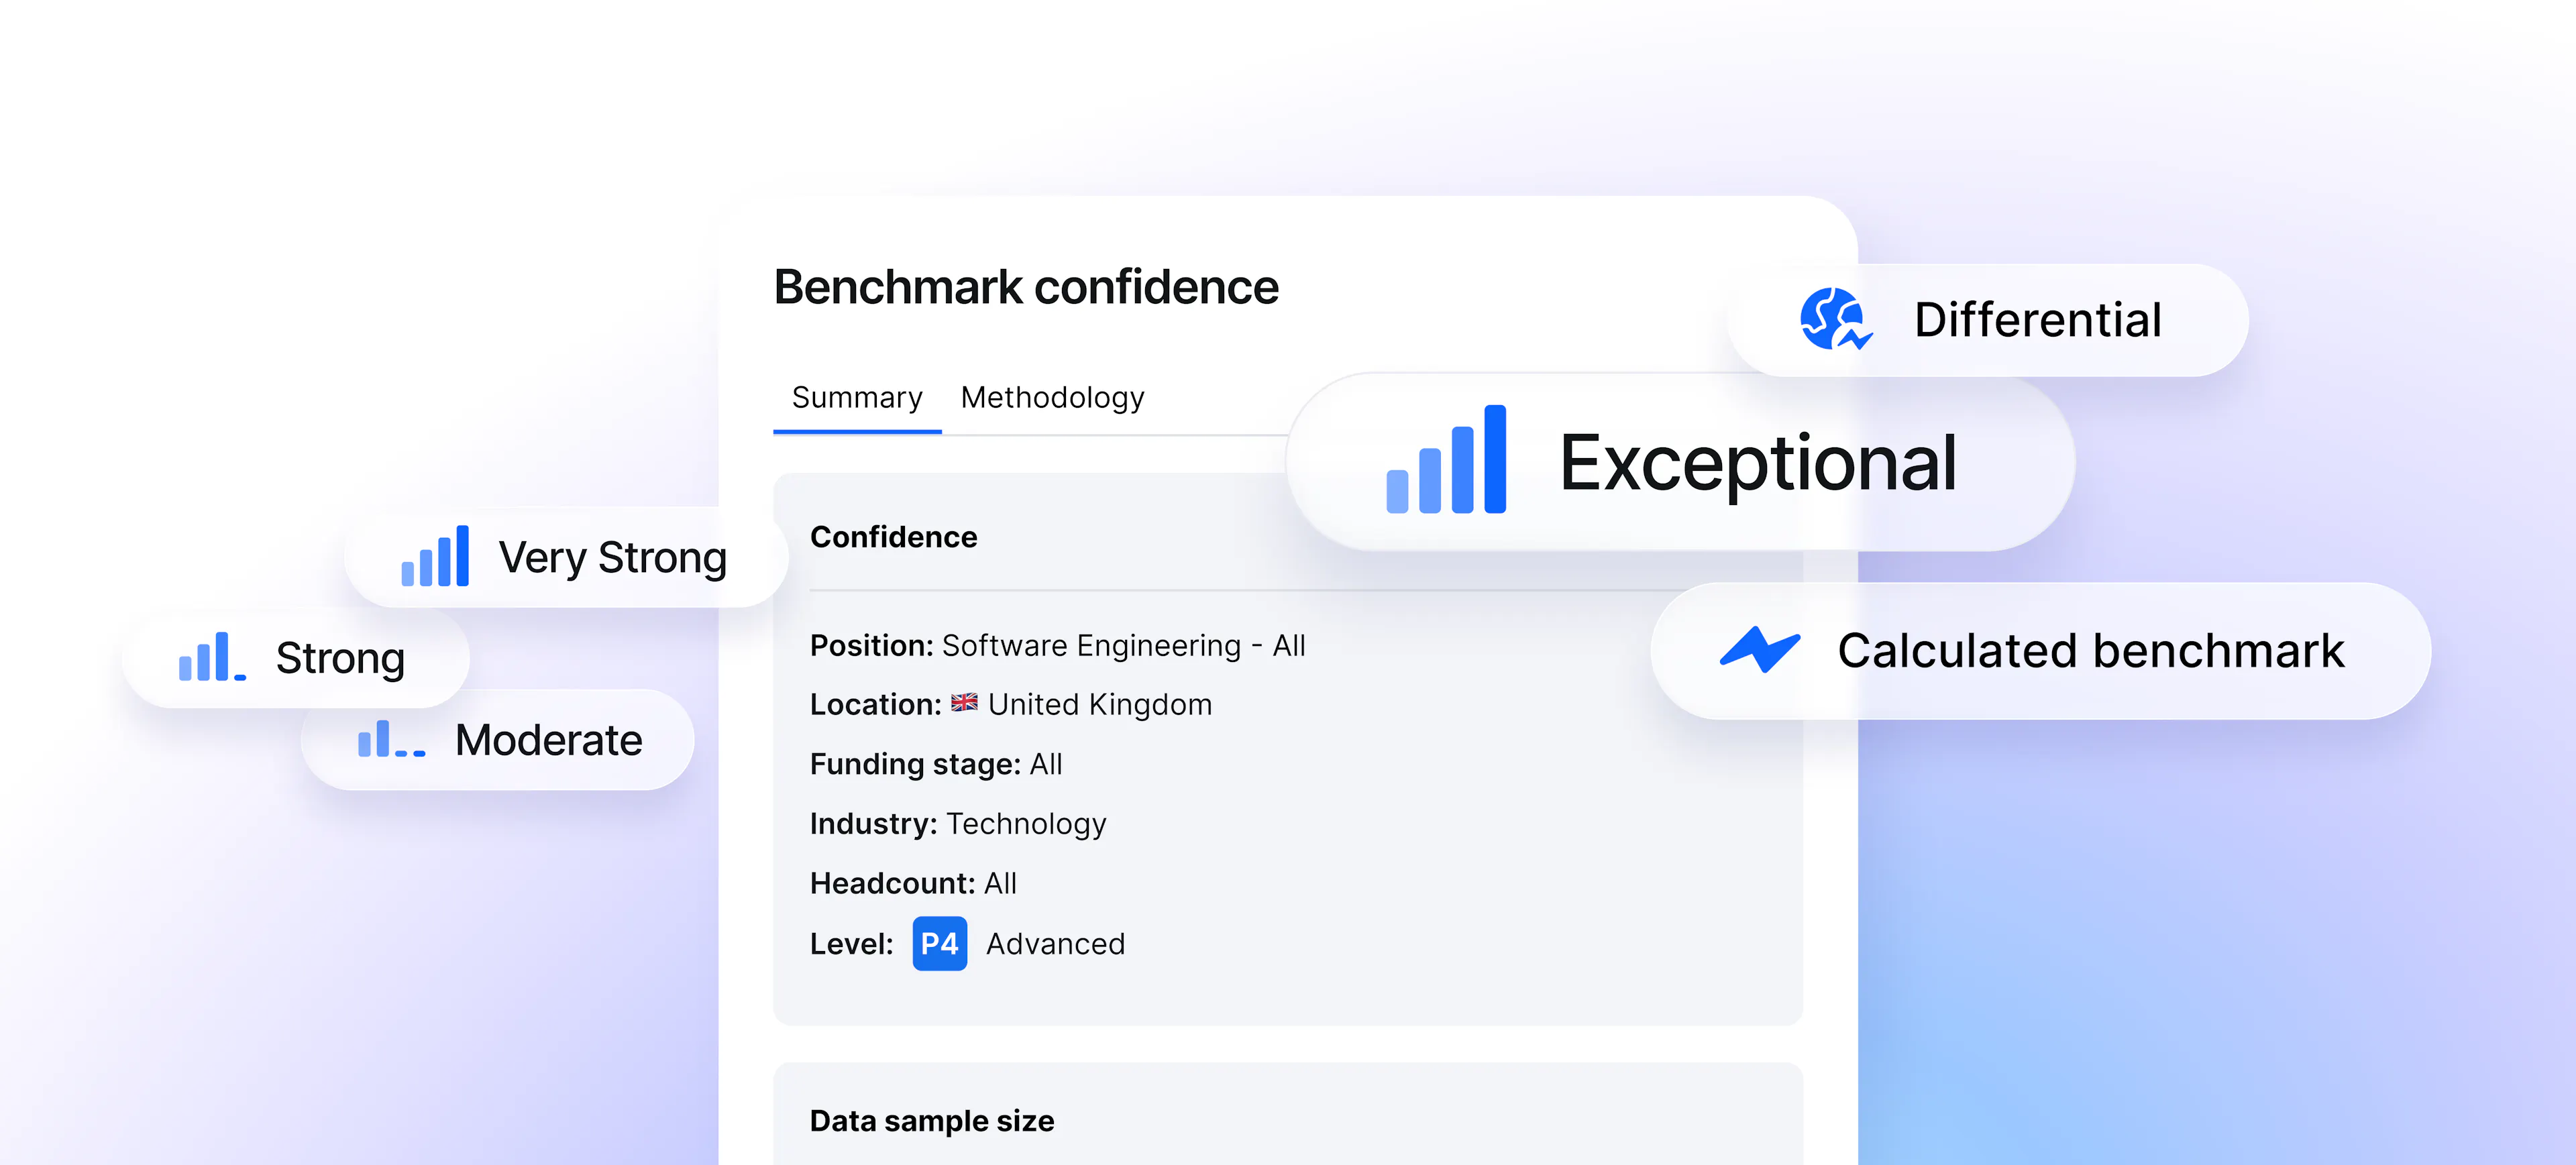
You'll notice there's no "low confidence" option. That's deliberate. We only publish benchmarks that meet our quality thresholds – if we can't defend it, we don't publish it.
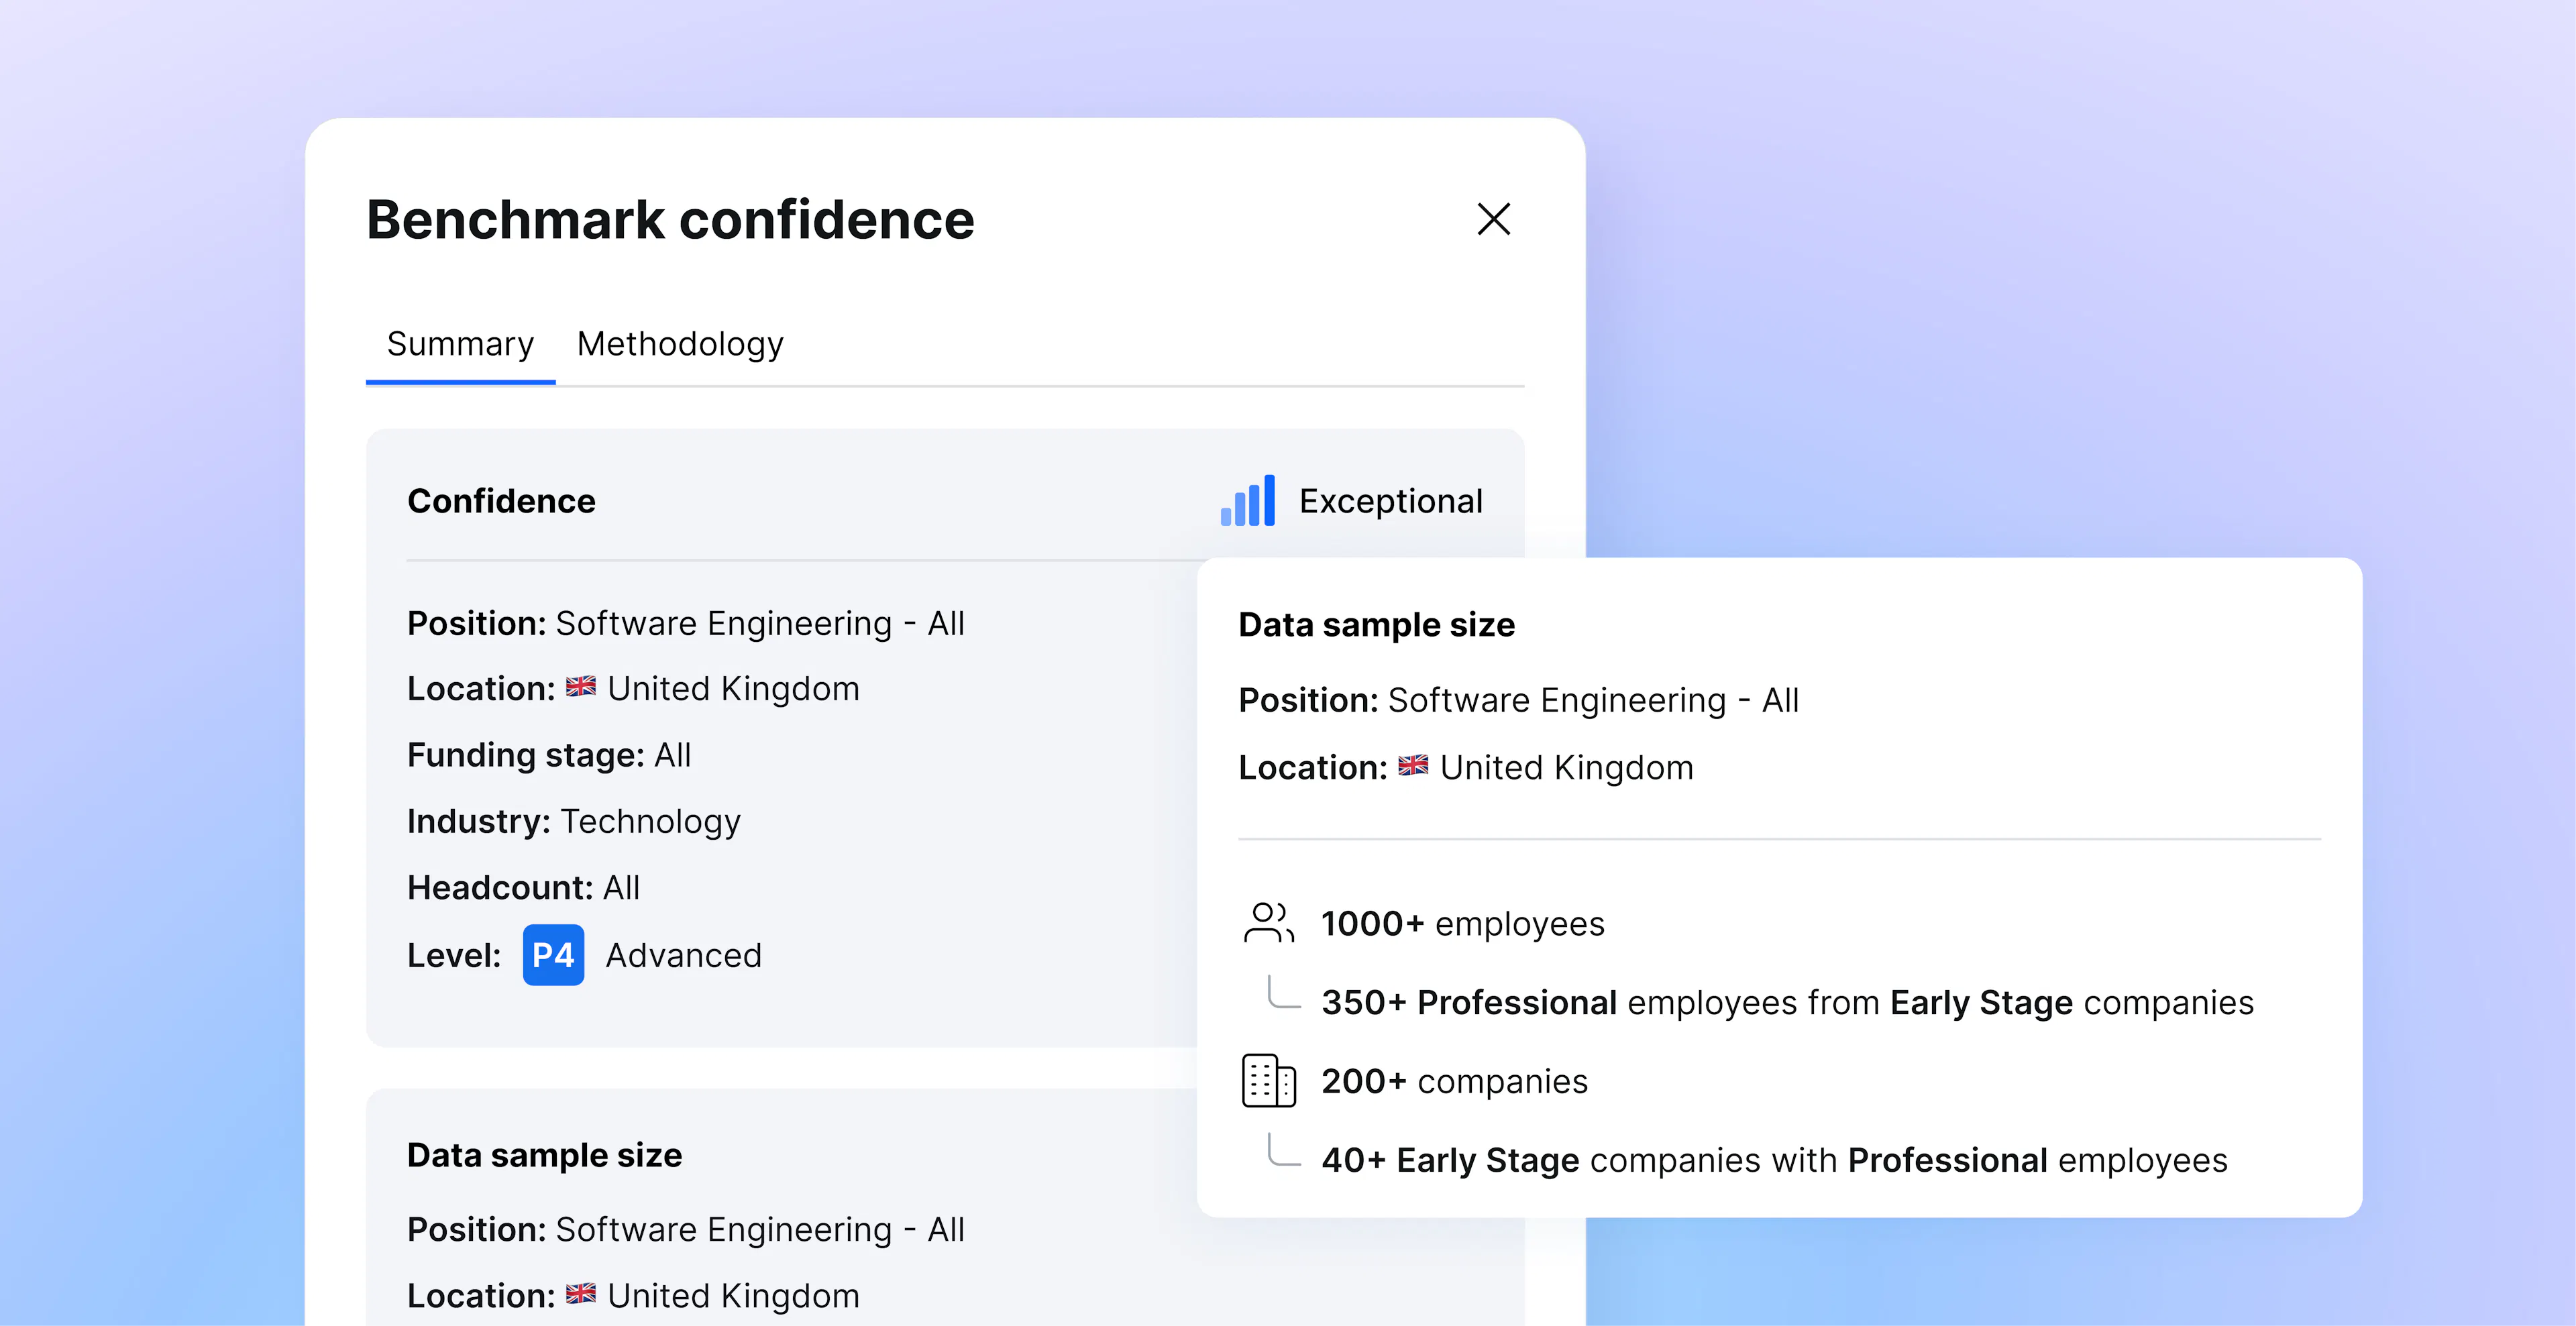
Click into any benchmark and you'll see the methodology: verified data sources, in-house mapping and levelling, real-time validation, and the QA checks we run before publication.
For each benchmark we give you precise sample sizes. Our Exceptional benchmarks are built on a large number of employees from a diverse range of companies. For every benchmark, we give you the size of the dataset we used to build it, including the subset of data which aligns with your selected filters.
Filling gaps without hiding the method
When our market data doesn’t meet our publishing thresholds (it may not be large or diverse enough), we use calculated benchmarks. Gap filling between experience levels, comparative analysis from similar roles, regional market factors. Rather than hiding behind a “black box”, we show how the benchmark was produced in our new Methodology tab.
Location differentials work similarly. When we have strong data in a base location but limited coverage for your target market and role combination, we calculate a role-specific differential and show you the reference locations and positions that informed it.
- Reference location: We use a suitable reference location that correlates with your target benchmark location.
- Optimal base position selection: We select an optimal base position that correlates with your benchmark position – typically other positions within the same function.
- Role-specific differential calculation: We calculate the role-specific differential between the base benchmark and target benchmark based on a relevant location, positions, levels, and market filters.
- Benchmark calculation: We multiply the base benchmark by the differential to calculate the target benchmark.
Why this matters
Picture this: Your CFO questions the Senior Engineer band you've just proposed. "Why is it £15k higher than last year?"
Without methodology transparency, you're relying on trust.
With it, you're showing data: verified HRIS data from 200+ companies in your peer group, rigorously validated by human QA checks, refreshed monthly from real-time data. "Trust me" becomes "here's how we know".
That's the difference transparency makes. Fewer debates. More autonomy. Confident compensation decisions backed by defensible benchmarks.
The bottom line
Confidence isn't about trusting us blindly. It's about understanding the methodology behind the benchmark - so you can show your working.
Every benchmark. Every confidence level. Every methodology decision. There to inform your decisions.