ReportSee where pay is heading in 2027View report

Total cost of employment: how much does a tech hire really cost in each country?

HiringMarket trends

There are two all-too-common moments when Reward teams get asked what an employee really costs.

The first is when the business is weighing up a new hiring market. Leadership wants to know what a Software Engineer will cost in Lisbon, Tallinn, or Bangalore – and how that compares with the markets you already hire in.

The second comes from Finance. The CFO needs the full cost of the headcount you already have. Not just salary, but the view of everything the company pays on top.

Both need the same number – total cost of employment.

But it's one Reward teams don't always have to hand.

Salaries, easy. But employer costs – social security, pension contributions, all those other mandatory extra payments – vary by country and sit in a bunch of different systems. 

That leaves teams either using salaries alone to model cost-to-hire, or applying a standardised multiplier. 

Neither of which give an accurate answer to those leadership stakeholders asking questions.

So we've combined Ravio's salary benchmarks with Playroll's employer cost data across 42 countries to give an accurate picture of what the same hire actually costs in each location – as well as insights from Megan Holesgrove, Team Lead, R&D at Playroll, on how teams usually approach costing hires in different locations.

Here's what the data shows.

How much do employer costs vary across Europe?

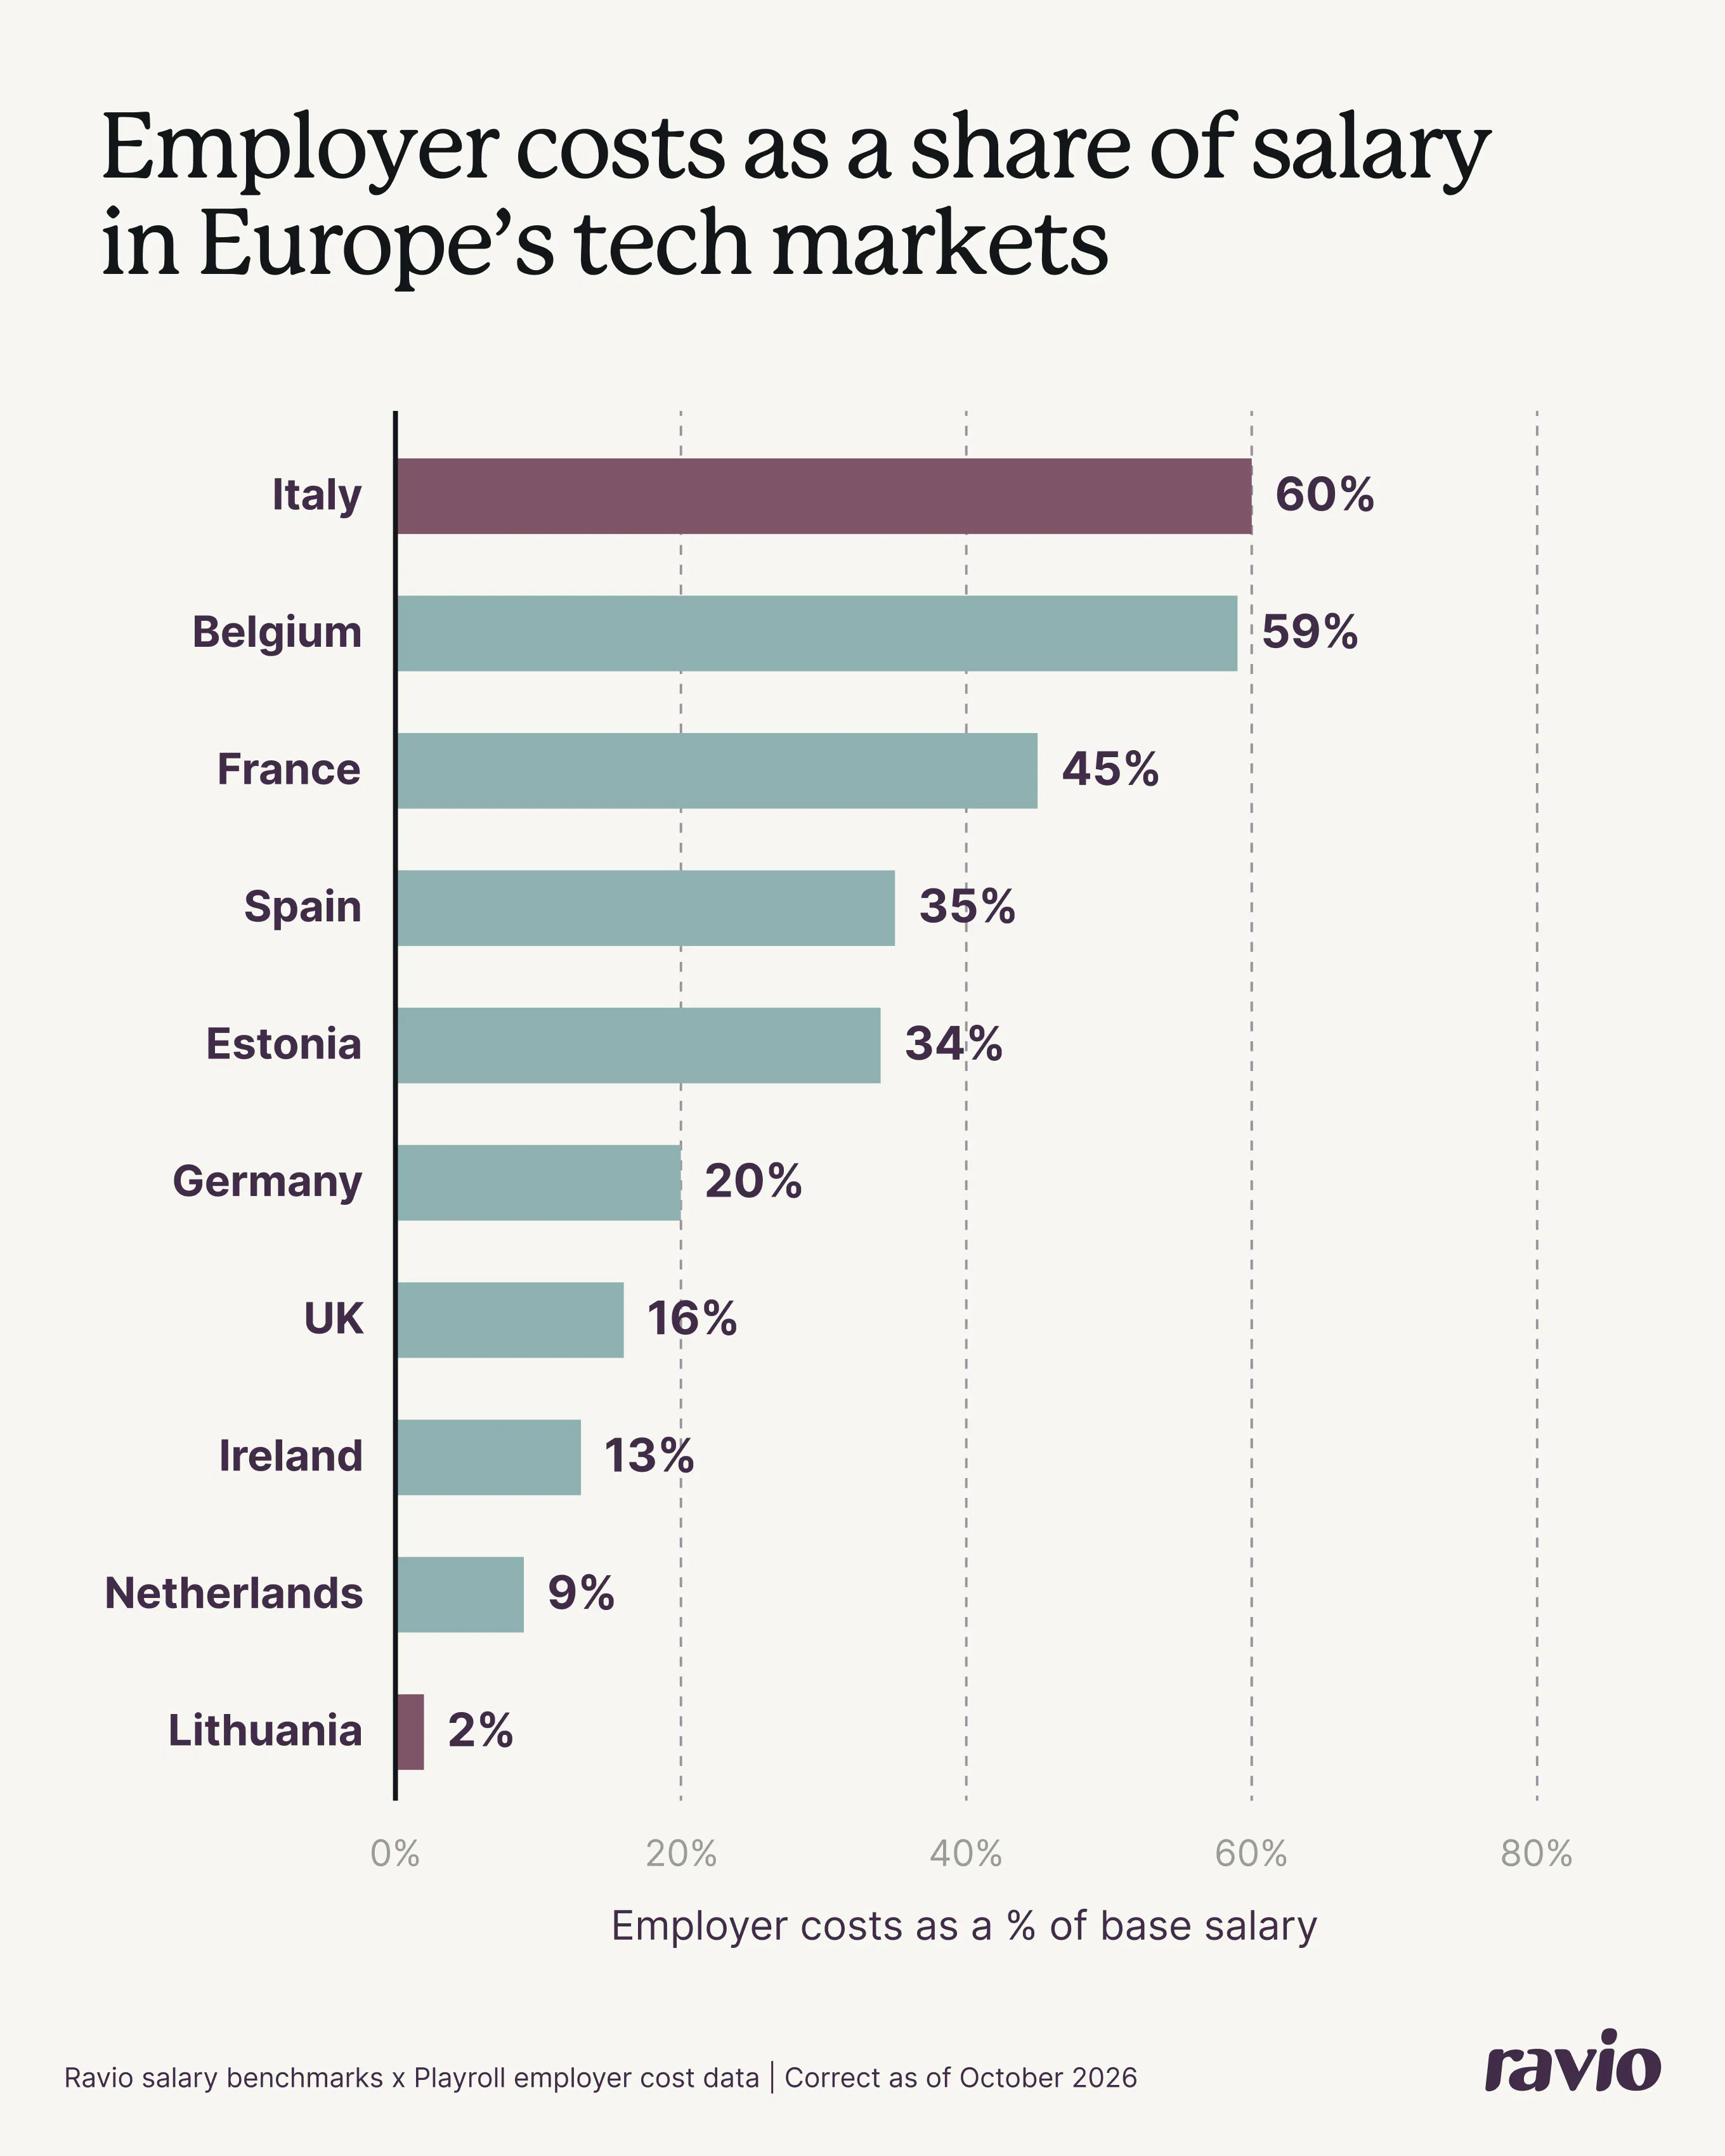
Within Europe, employer costs range from 2% of salary in Lithuania and Romania to 60% in Italy – so relying on a single multiplier for "Europe" to run costs could be wrong by up to 58 percentage points, depending on the country.

Below is a breakdown of employer costs for a selection of core European markets, as a percentage of salary. Throughout this analysis, we’ve calculated employer costs for the median (P50) salary of a P3 (mid-level) Software Engineer in each country.

Country

Employer costs (% of salary)

Main employer cost types (% of salary)

Italy

60%

Social security 35%, 13th and 14th month pay 16.7%, end-of-service gratuity 8.1%

Belgium

59%

Social security 39%, 13th month and double holiday pay 16%, meal allowance 3.4%

France

45%

Pension 16.9%, health insurance 13.5%, family benefits 5.3%

Spain

35%

Social security 24%, unemployment insurance 5.6%

Estonia

34%

Pension 20%, health insurance 13%

Germany

20%

Pension 9.3%, health insurance 7%, long-term care insurance 1.6%

UK

16%

National Insurance 13.9%, pension 1.9%

Ireland

13%

Social insurance (PRSI) 11.3%, pension 1.5%

Netherlands

9%

Health insurance 6.1%, unemployment insurance 2.7%

Lithuania

2%

Unemployment insurance 1.3%

Looking at the countries above, Italy (60%) and Belgium (59%) stand out as the markets with the highest employer costs. In both, employer costs add more than half again on top of salary. 

What pushes them that high is a combination of two things. 

First, high social security rates: 35% in Italy and 39% in Belgium. 

Second, mandatory extra salary payments on top. Italy’s 13th and 14th month pay adds another 16.7%, and Belgium’s 13th month and double holiday pay add 16%. 

France (45%) is the third highest for employer costs, and is one of Europe’s biggest tech hiring markets. Here the cost comes from contributions rather than extra payments, mainly pension (16.9%) and health insurance (13.5%). 

At the bottom, the Netherlands (9%) has the lowest employer costs of the Western European markets. 

Lithuania is lowest of all at 2% – and that’s because most social security contributions there are paid by the employee rather than the employer.

Employer costs as a share of salary in Europe's tech markets

If the country you need to cost isn’t listed here, head to the Playroll x Ravio cost to hire calculator – it covers all the common tech hiring markets.

One note: the tool shows employer costs as a share of the total cost of employment, while this blog shows them as a share of salary. For example, Italy’s employer costs add 60% to salary, which works out as 38% of the total cost of employment, the figure you’ll see in the tool.

What about employer costs in other common global tech hiring markets?

When we look beyond Europe, the range is even wider.

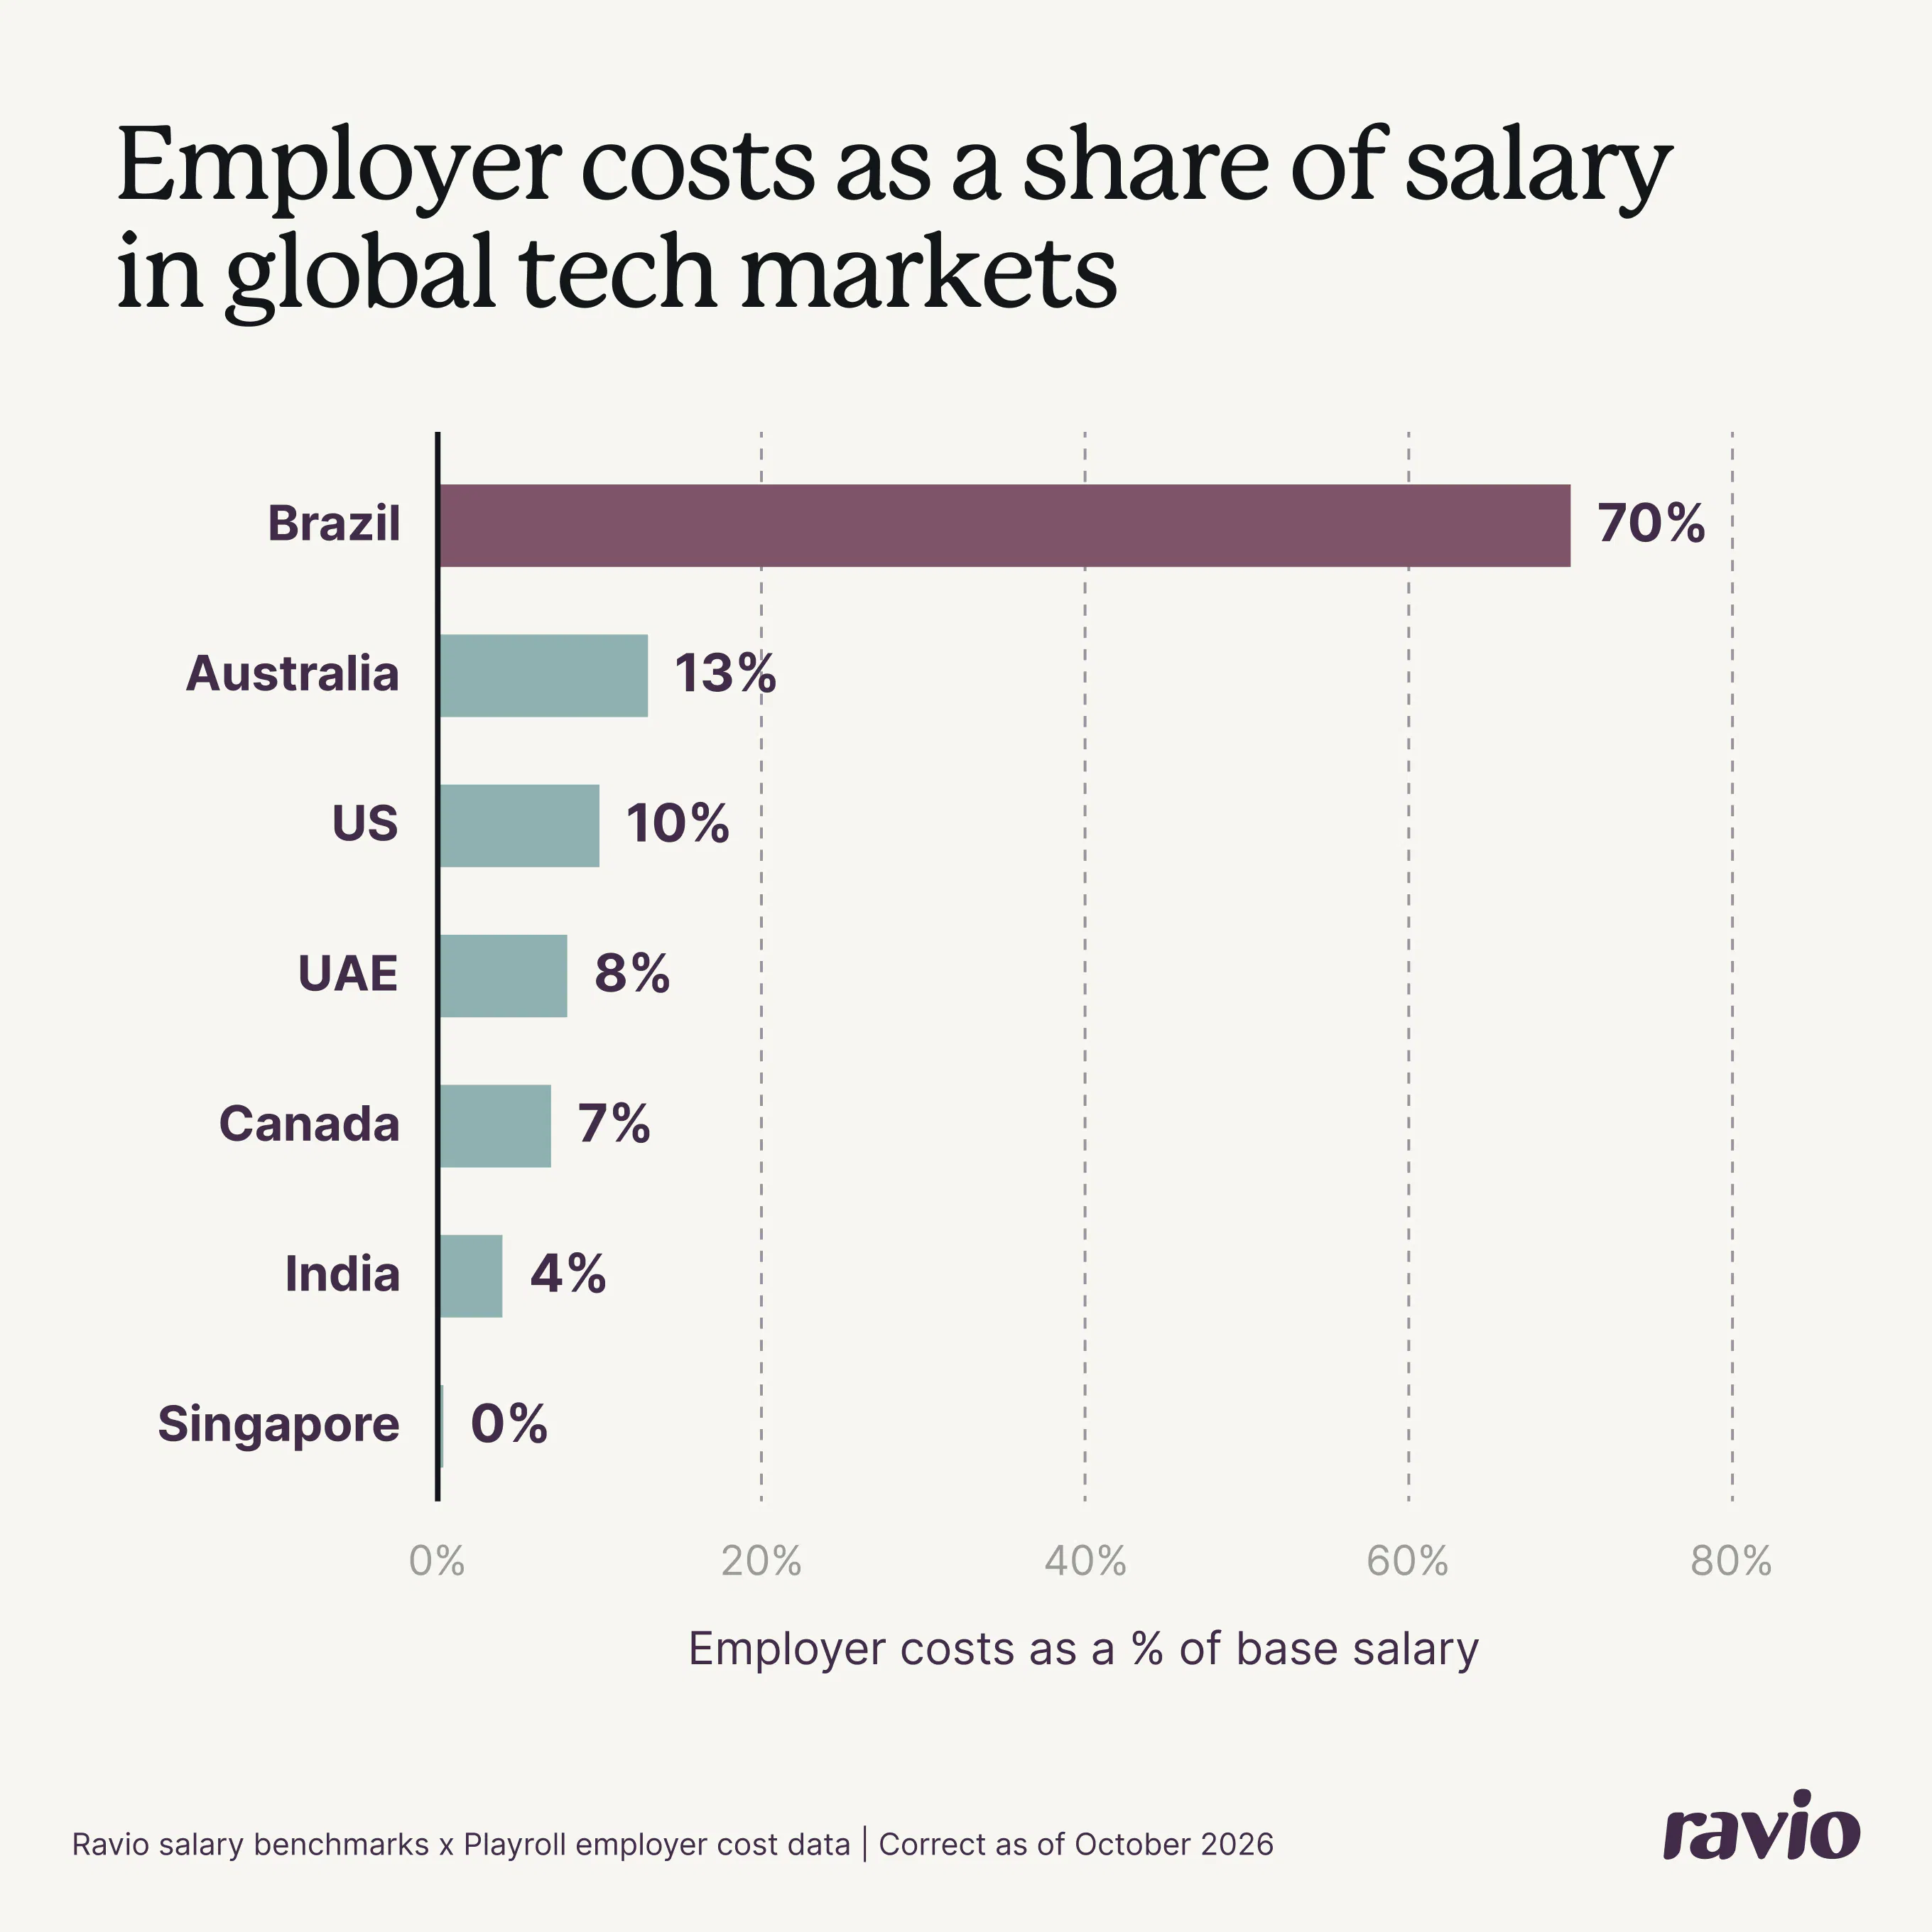
Employer costs add between 0% (Singapore) and 70% (Brazil) to a Software Engineer’s salary – again, we’re using a select number of tech hotspots here, but if you’re looking for data on a different location head to the full employer cost calculator.

Country

Employer costs (% of salary)

Main employer cost types (% of salary)

Brazil

70%

Social security 26.8% (incl. social tax), holiday pay 11.1%, 13th month pay 8.3%, severance fund 8%, contributions on holiday and 13th month pay 7%

Australia

13%

Pension (superannuation) 12%, workers’ compensation 1.4%

US

10%

Social security 6.2%, unemployment insurance 2.2%, Medicare 1.4%

UAE

8%

End-of-service gratuity 5.8%, health insurance 2.6%

Canada

7%

Pension 5.8%, employment insurance 1.6%

India

4%

Gratuity 2.6%, pension 0.8%

Singapore

0%

Accident insurance and skills levy (under 0.5% combined)

Brazil is the clear outlier, with the highest employer costs in our entire dataset. 

It combines social security contributions of around 27% of salary with almost every type of extra payment we see in Europe: holiday pay, a mandatory 13th month salary, and contributions to a severance fund. Brazil then charges social contributions on those extra payments too, adding another 7%.

Together, these add more to salary than in any European market.

The other six markets all sit at 13% or below – lower than most of the European countries we analysed.

In most of them, one contribution is the culprit for most employer costs – but that contribution is different for every market, because it’s so dependent on local laws. In Australia, for instance, it’s superannuation, whereas in the US it’s social security, and in the UAE end-of-service gratuity. 

The US figure comes with a caveat. Health insurance is a voluntary benefit there, so it isn’t included, but most US tech employers offer it. In practice, the real cost of a US hire is likely higher than 10% on top of salary.

Employer costs as a share of salary in global tech hiring markets

Where do employer costs typically come from?

Most employer costs are contributions set by law. Employers pay a percentage of salary to fund social security, pensions, and health systems.

Some countries then add further payments on top – extra months of salary, holiday pay, or meal allowances – that are either mandatory or standard market practice.

Across the countries in our data, five types of employer cost come up most often:

  • Social security: in 24 countries, typically around 12% of salary – rising to 35% in Italy and Sweden
  • Pension: in 22 countries, typically around 9% – rising to 20% in Estonia
  • Unemployment insurance: in 18 countries, typically around 1%
  • Accident insurance: in 18 countries, usually well under 1%
  • Health insurance: in 14 countries, typically around 5% – rising to 13.5% in France

The highest employer costs come from one of two places:

  • A high social security rate – like in Italy (35%), Sweden (35.2%), and Belgium (39%).
  • Extra salary payments on top of contributions. In Austria, Italy, and Portugal, 13th and 14th month payments add around 17% to salary in each. In Sweden, Norway, and Denmark, holiday pay adds around 12% – and Brazil has both.

Those extra payments also catch companies out in a different way, because of how they’re paid.

“It usually shows up as an invoice that’s higher than the planned budget,” says Megan Holesgrove, Team Lead, R&D at Playroll. “Things like a 13th-month salary, holiday pay and termination entitlements build up in the background, and if nobody planned for them, they reflect as a lump sum the finance team didn’t see coming.”

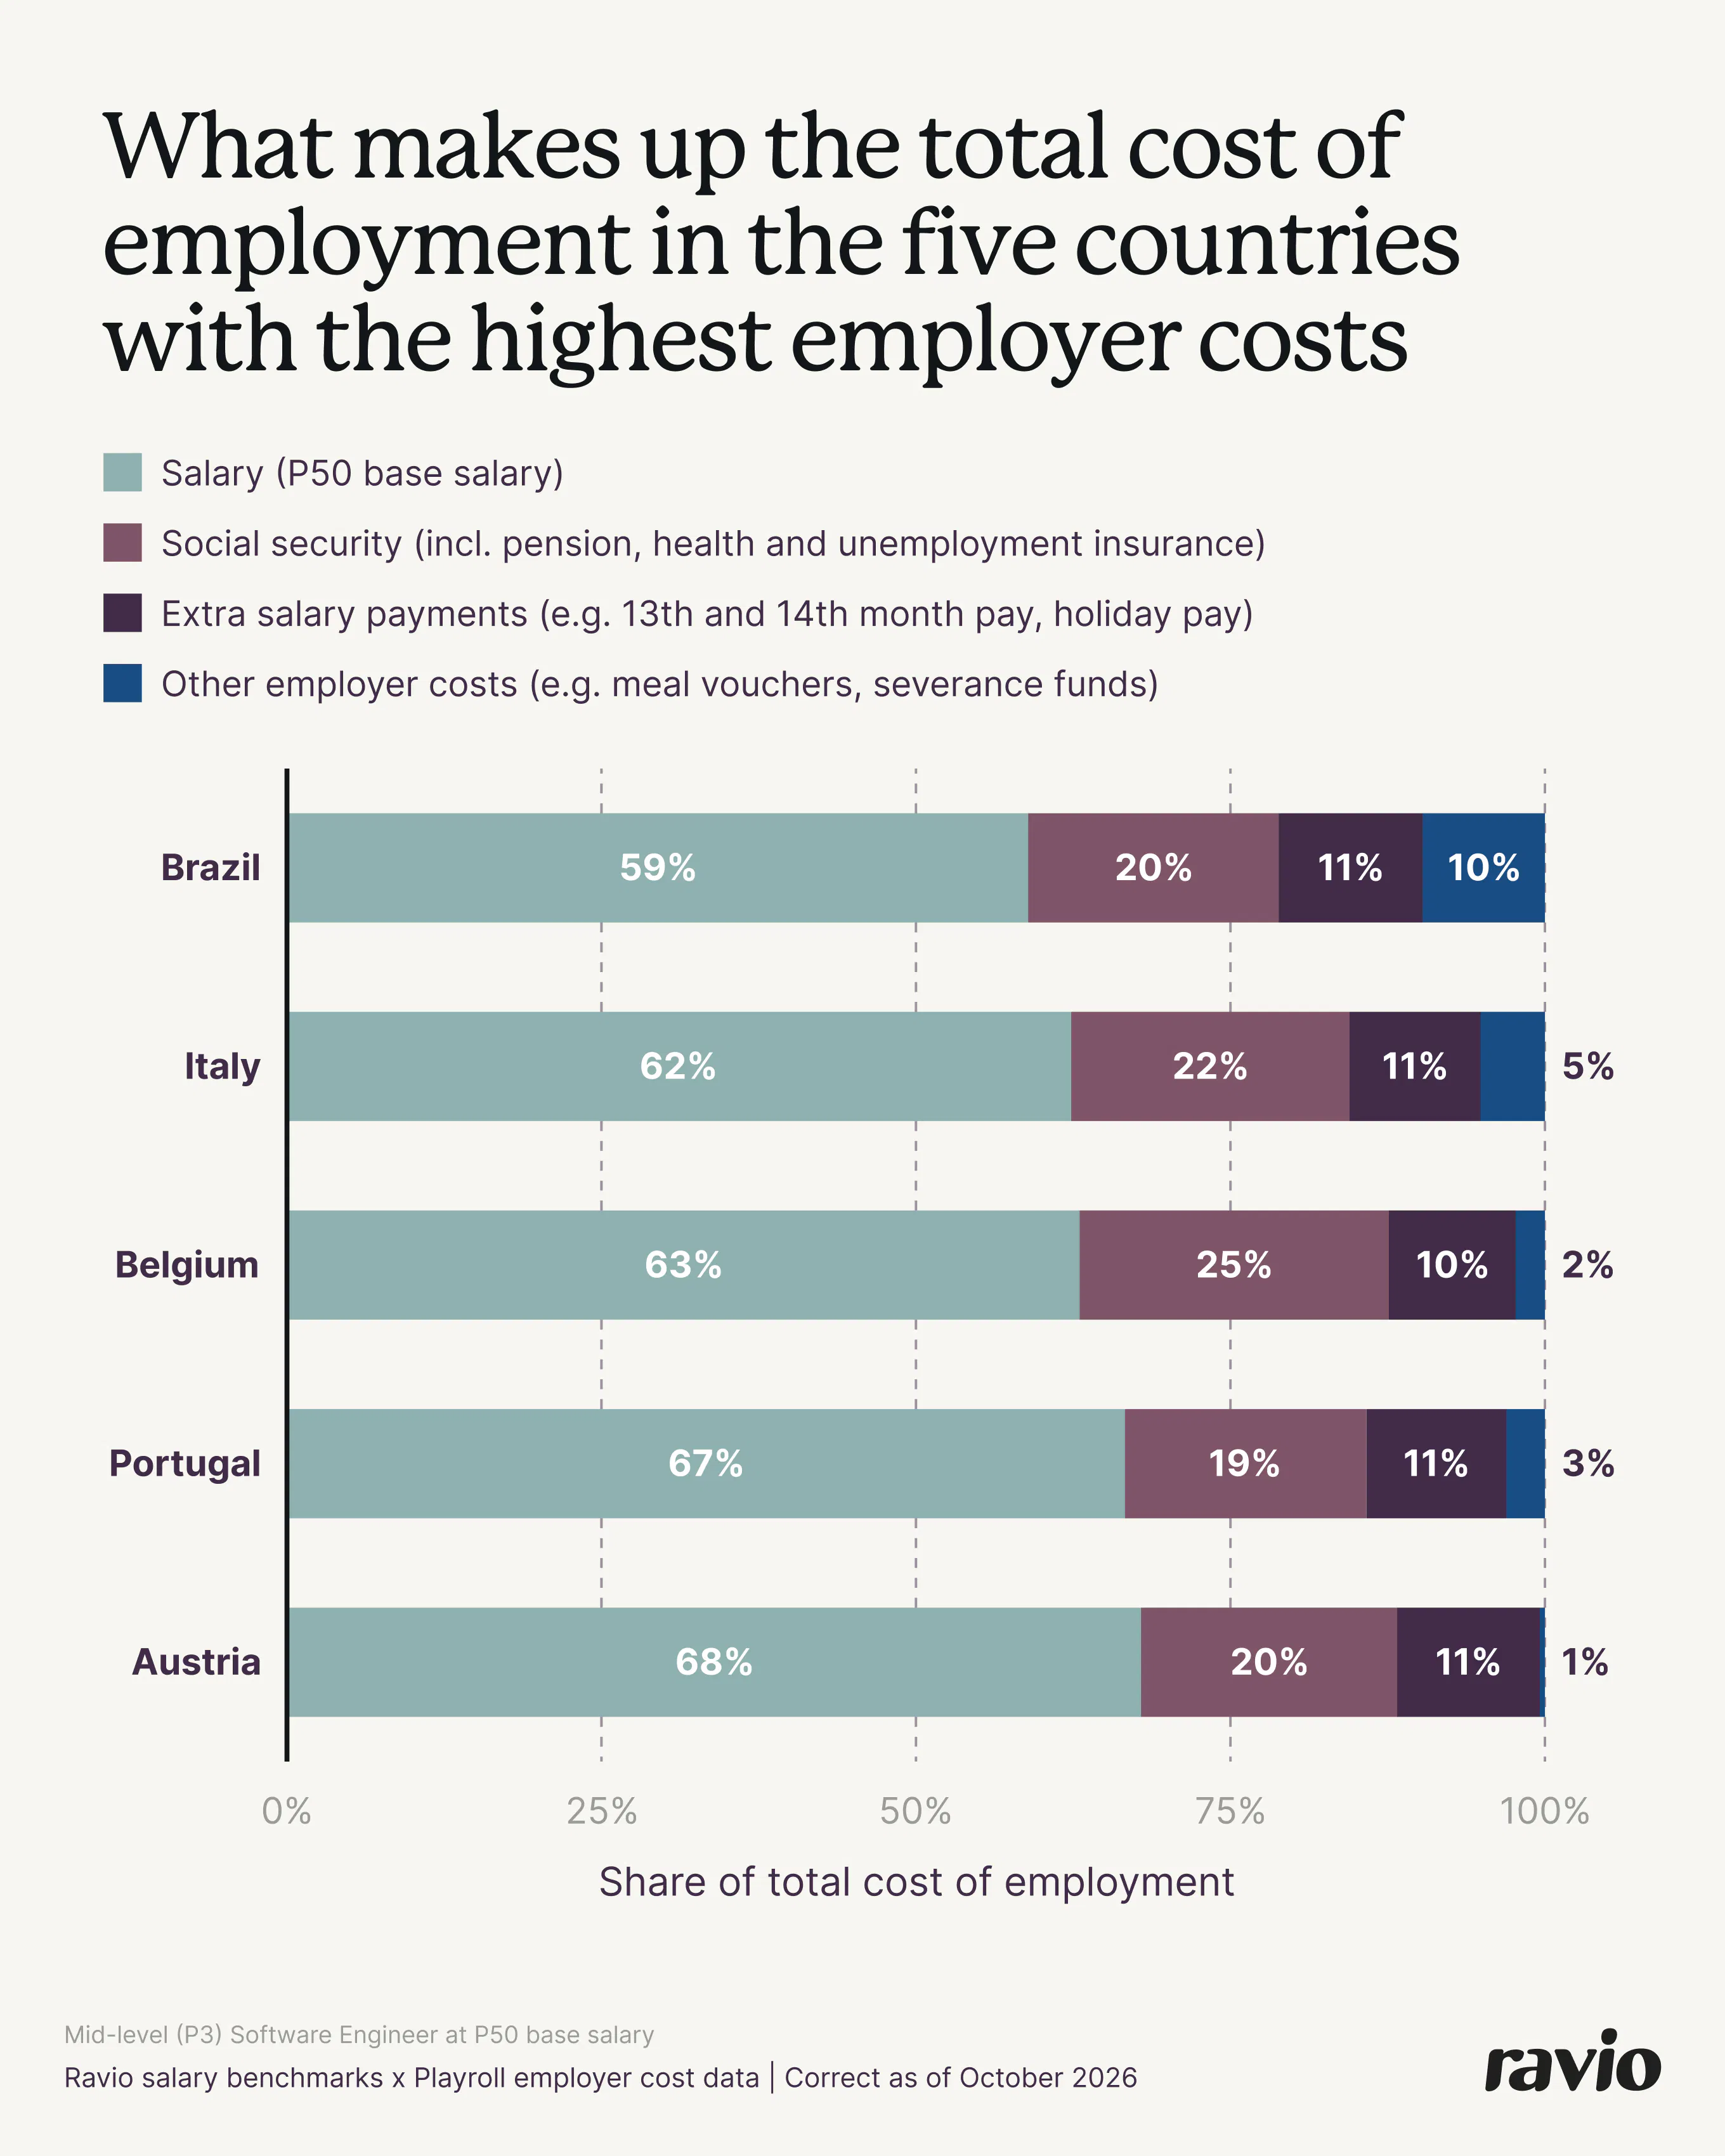
Here’s how that looks for the five markets with the highest employer costs, showing each cost as a share of the total cost of employment rather than salary.

Total cost of employment breakdown: Brazil (59% salary, 20% social security, 11% extra salary payments, 10% other employer costs).

What does this mean for the total cost of employment?

To see the true cost of a hire, we’ve added Ravio’s salary benchmarks to the employer costs to get the total cost of employment.

As before, we’ve used the median salary for a P3 (mid-level) Software Engineer in each market as our example, and converted all local currencies to euros to give a standardised comparison (using European Central Bank (ECB) reference rates on 7 October 2026).

One thing to bear in mind here: these percentages are for a mid-level salary, and they won’t hold at every level. “Some countries cap social contributions at a certain income level, so a senior hire there can cost less than you’d expect,” says Megan.

Country

P50 salary

Employer cost – % of base salary

Employer cost – amount

Total cost of employment

US

€137,800

10%

€13,700

€151,500

Belgium

€73,700

59%

€43,200

€116,900

Italy

€62,700

60%

€37,900

€100,600

France

€68,000

45%

€30,500

€98,500

Australia

€86,600

13%

€11,600

€98,200

Singapore

€97,500

0%

€200

€97,700

UK

€82,700

16%

€13,200

€95,900

Germany

€78,700

20%

€16,000

€94,700

Ireland

€75,700

13%

€9,700

€85,400

Netherlands

€76,000

9%

€7,100

€83,100

Spain

€60,300

35%

€20,900

€81,200

Estonia

€60,100

34%

€20,300

€80,400

UAE

€72,800

8%

€6,100

€78,900

Canada

€72,200

7%

€5,300

€77,500

Lithuania

€60,100

2%

€1,100

€61,200

Brazil

€29,900

70%

€20,800

€50,700

India

€24,100

4%

€900

€25,000

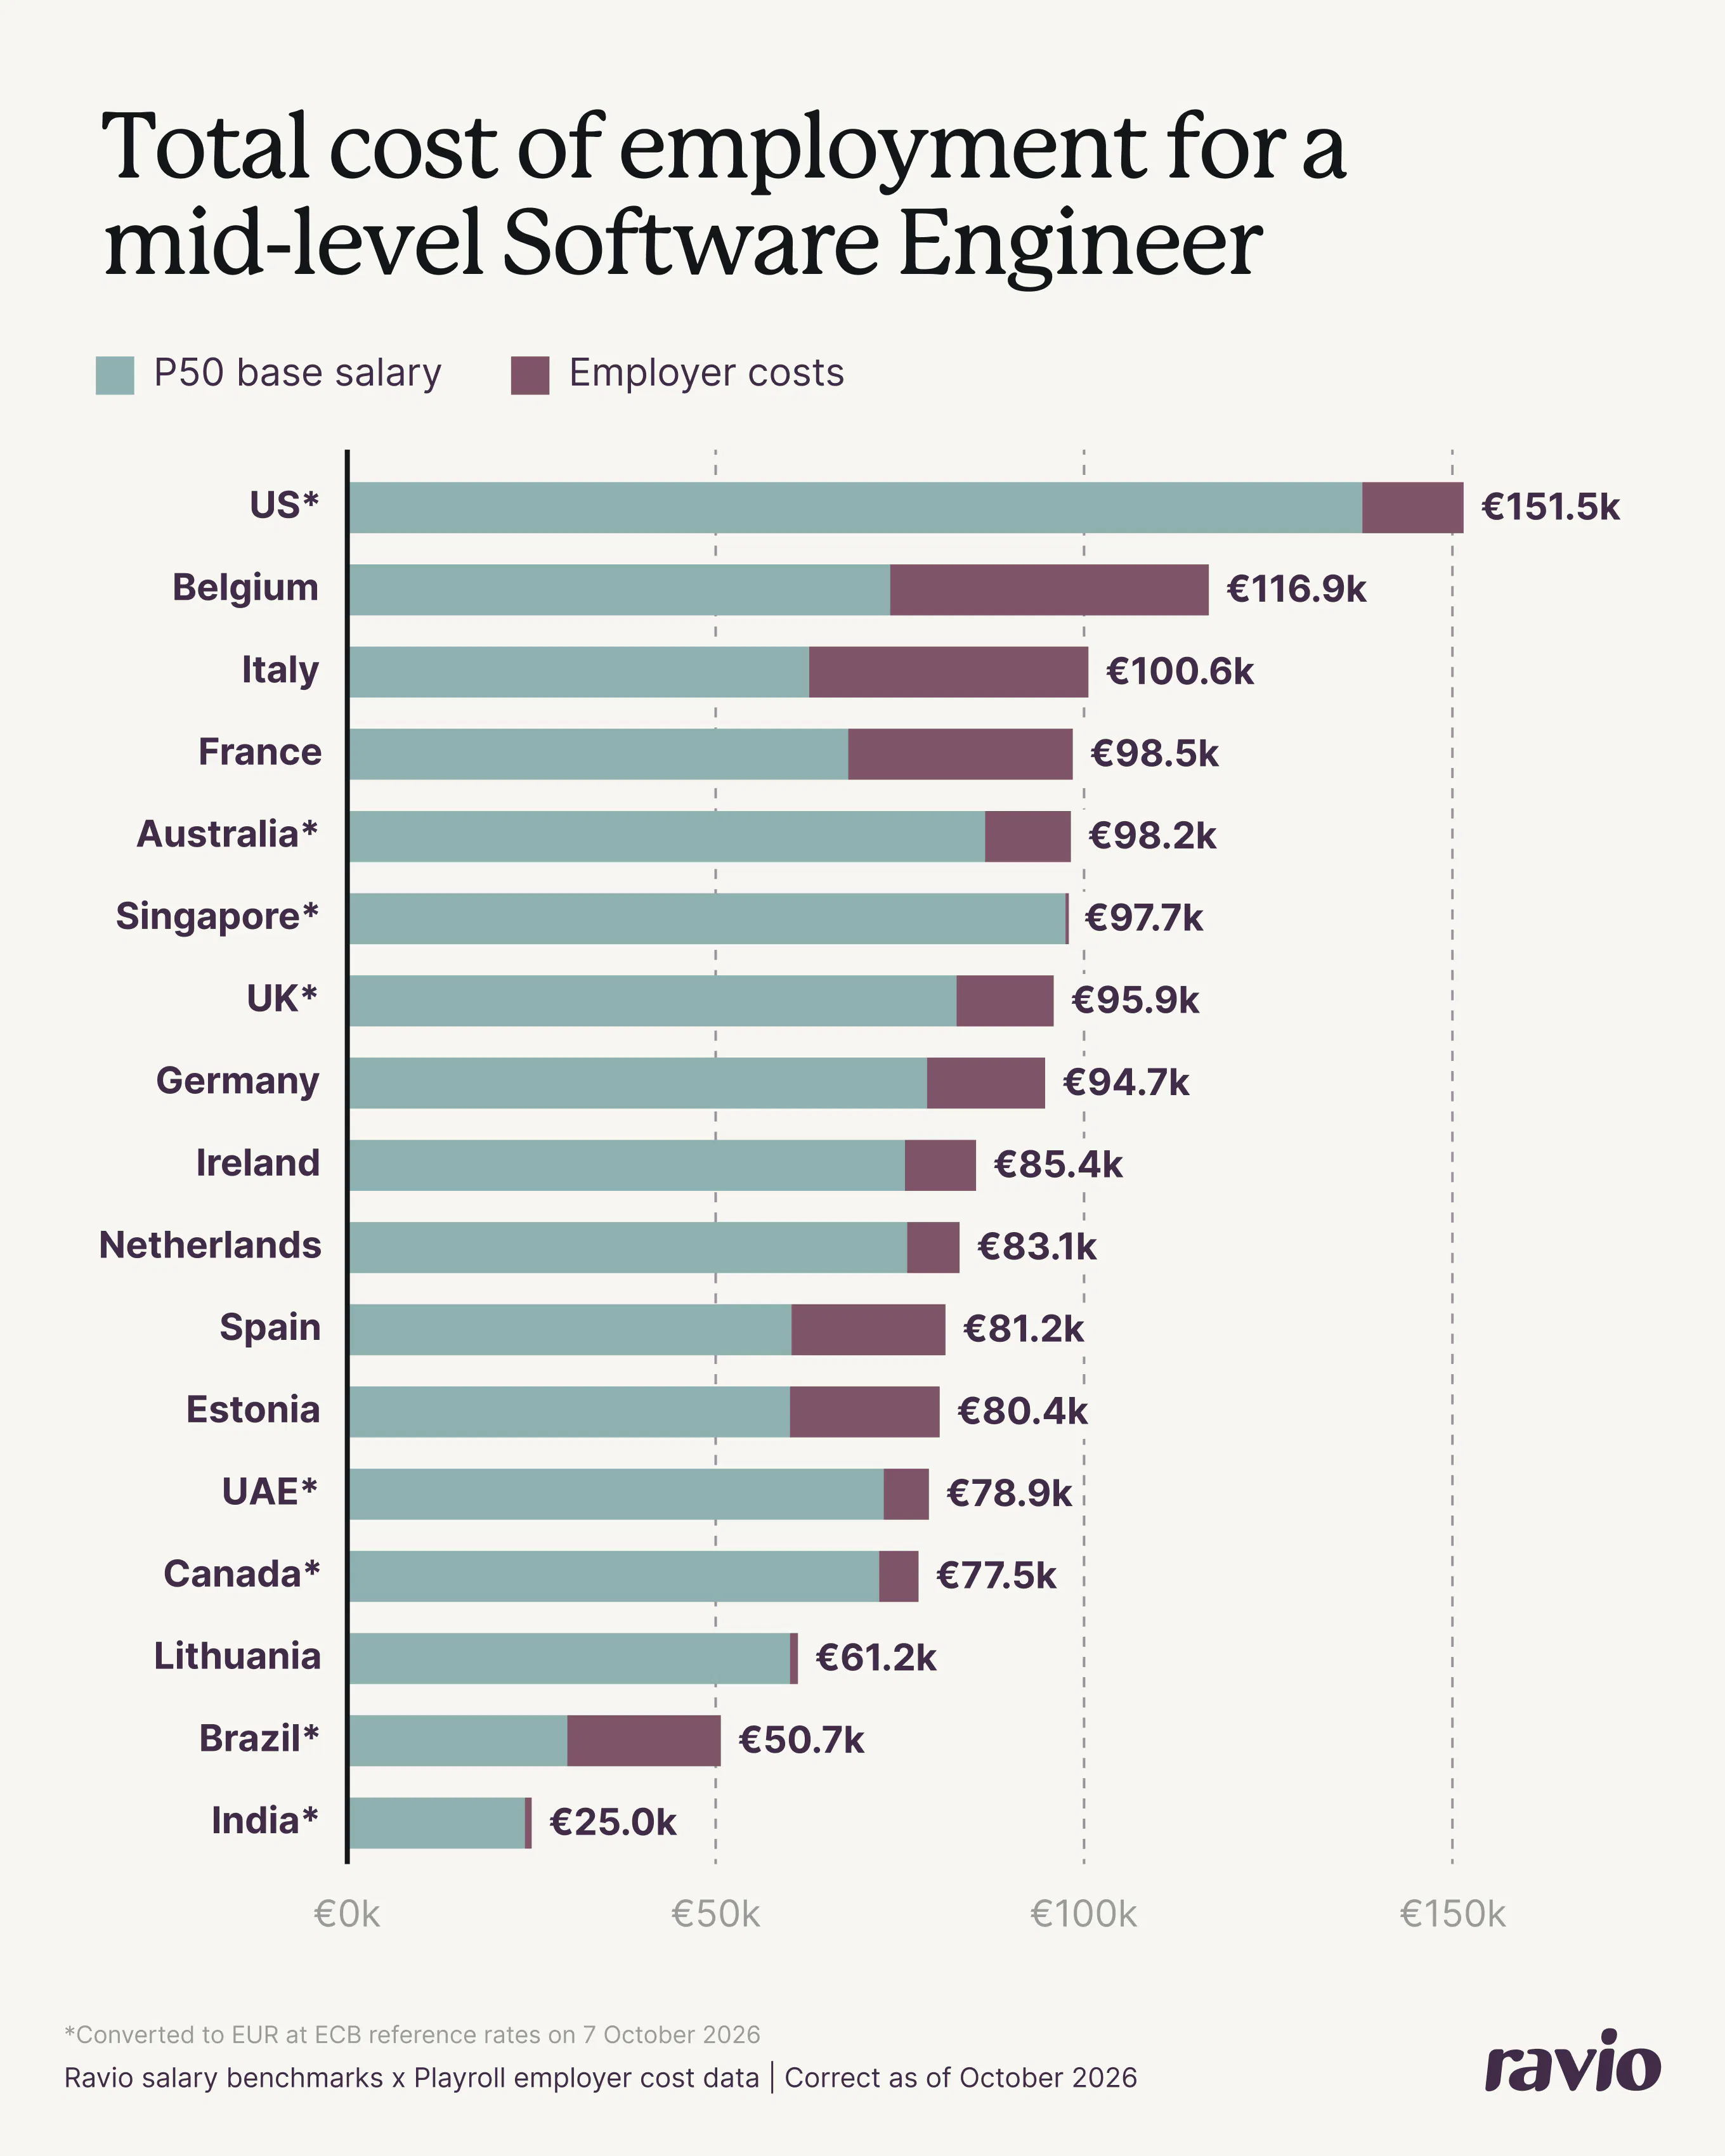
Once employer costs are added, the ranking changes. 

Belgium has the 8th highest salary across the markets analysed, but is the 2nd highest on total cost of employment once typical employer contributions are added. 

Similarly, Italy is the 12th most expensive hiring market when looking at salaries alone, but 3rd for total cost of employment, and France the 11th on salaries and 4th on total cost of employment. 

It swings the other way too – Singapore, with the second-highest salary, drops to being the 6th market for total cost of employment. The Netherlands also falls, from 6th to 10th.

In other words, markets that look cheaper on salary can end up costing the same as, or more than, markets with higher salaries.

Total cost of employment for a mid-level Software Engineer – using Ravio's salary benchmarks and Playroll's total employer cost data

For Megan, this is where location comparisons tend to go wrong.

“Most companies compare salaries first, and that’s where the picture gets distorted,” she says. “The real cost sits in the mandatory employer contributions, and those vary a lot from one country to the next.”

Here’s how that plays out across a couple of different example scenarios. 

Scenario 1: You’re opening a second engineering hub in Europe

Say you’re a UK- or Germany-based company looking for a second European office. You’ve shortlisted Amsterdam, Tallinn, and Vilnius.

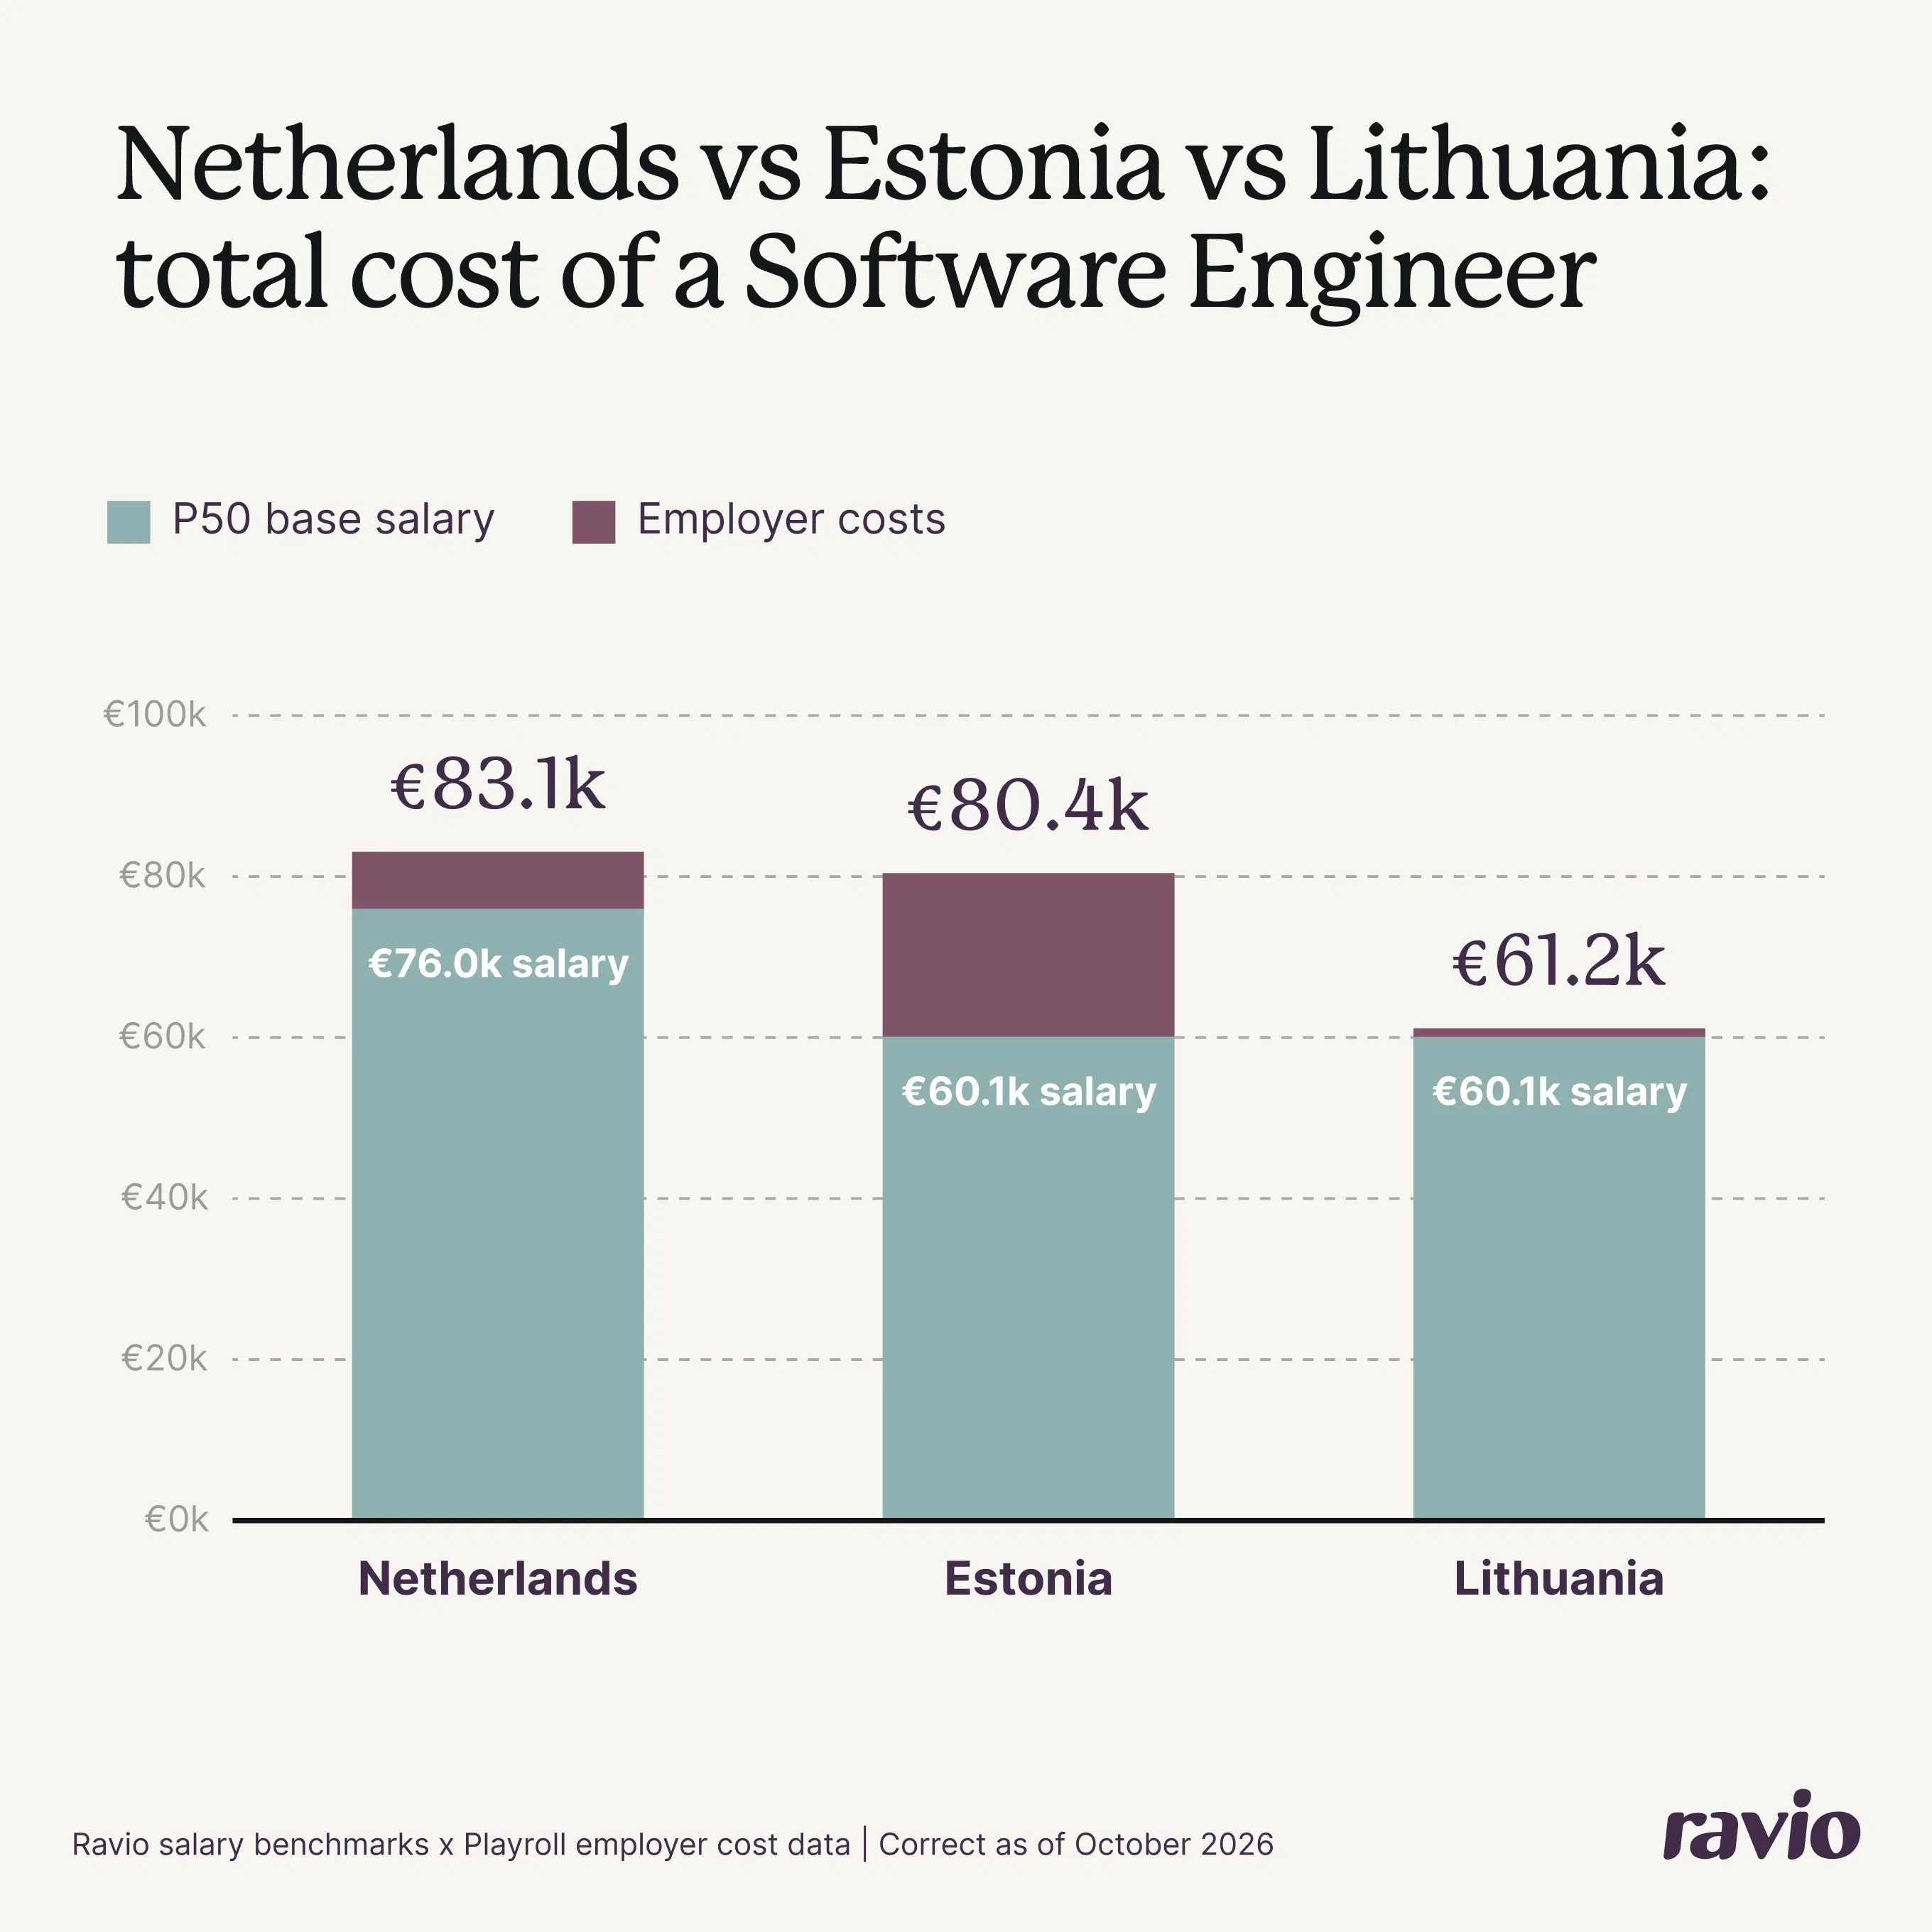
On salary alone, the decision looks simple. A P3 Software Engineer costs €60,100 in both Estonia and Lithuania, €15,900 less than the €76,000 you’d pay in the Netherlands.

But add employer costs and the shortlist looks very different. Estonia’s employer costs add 34% to salary, compared with 9% in the Netherlands. That cuts Estonia’s saving over Amsterdam from €15,900 to just €2,700 per hire.

Lithuania, at 2%, keeps almost all of its saving. A hire there costs €61,200 in total, against €80,400 in Estonia, even though the salaries are identical.

For a team of 10 engineers, that’s a difference of €192,500 a year between Tallinn and Vilnius – and that gives your stakeholders the accurate comparison they’re looking for. 

Netherlands vs Estonia vs Lithuania: total cost of a Software Engineer

Scenario 2: You’re building a team in a lower-cost market

Now say the brief is about affordability of talent.

Leadership wants to build out engineering capacity where salaries are significantly lower than in Europe. India and Brazil are both options on the table.

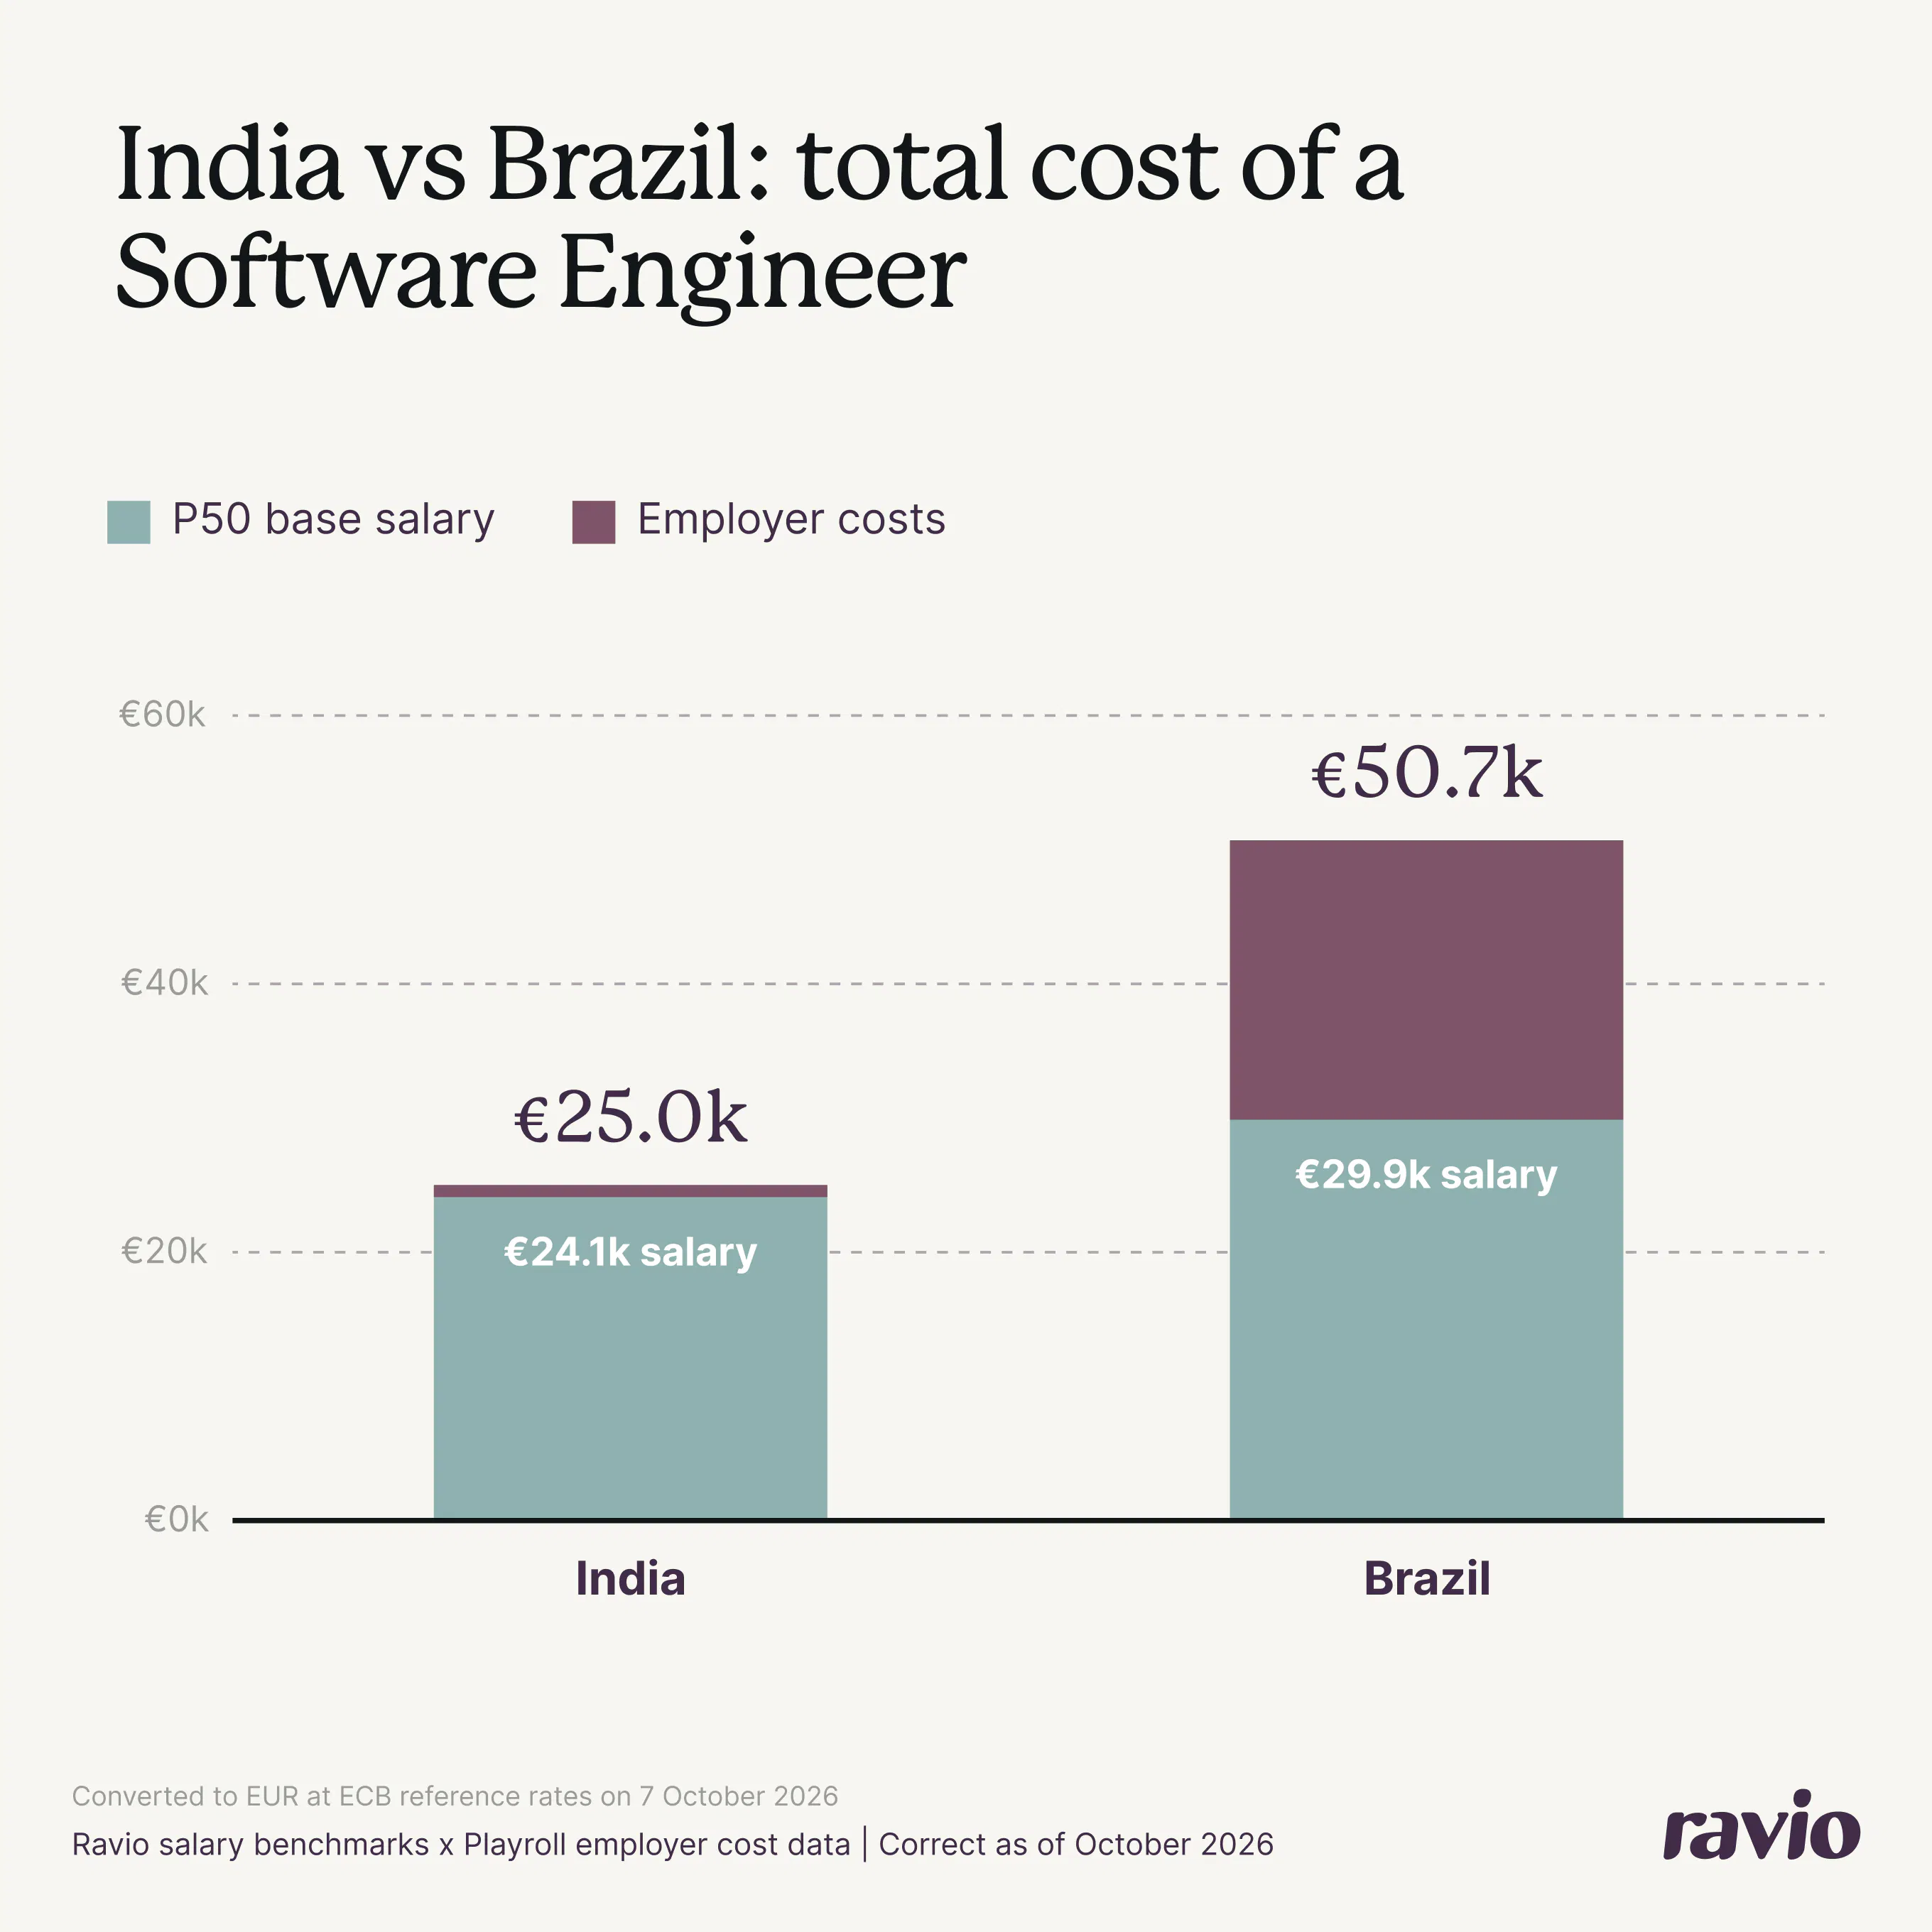
On salary, both look like strong options. A P3 Software Engineer earns €24,100 in India and €29,900 in Brazil. That’s less than half the salary in any of the European markets we’ve looked at. (Read more on how India’s tech salaries compare to Europe.)

But the two markets handle employer costs very differently.

In India, employer costs add 4% (€900), so total cost per hire is €25,000. In Brazil, employer costs add 70% (€20,800), taking the total cost to €50,700. 

So a hire in Brazil actually costs twice as much as one in India, despite a salary only €5,800 higher. For a team of 10, India costs €250,200 a year and Brazil €507,100.

India vs Brazil: total cost of a Software Engineer

What this means for your hiring and workforce reporting

Across the markets we’ve analysed, the most expensive places to hire on salary aren’t always the most expensive places to employ.

Belgium, Italy, and France all cost more than the UK, Germany, and the Netherlands once employer costs are added, even though they pay less.

If you’re building the business case for a new hiring location, or reporting on the cost of your workforce, that gap can quickly add up to an inaccurate view.

So what should a full total cost of employment view include? Here are four tips from Megan:

Build it country by country

For Megan, the starting point is simple.

“Start with the basics: gross salary plus the employer’s statutory contributions,” she says. “Depending on the country, that covers social security, pension, unemployment insurance, health insurance, and accident insurance.”

The difficulty is doing that accurately for every market you hire in. Megan has seen plenty of larger teams asked by their CFO for the full cost of a workforce spread across several countries.

“Don’t try to be an expert in every country yourself,” she advises. “At Playroll, we have analysts who specialise in specific territories. They either get quotes from local providers or build the costings internally, so every figure reflects how that country actually works. That’s what gives a CFO numbers they can rely on, rather than a spreadsheet of salaries with a flat percentage added on top.”

Look beyond the statutory costs

Our figures exclude voluntary benefits, but in many markets, those aren’t really optional if you want to hire – and typical benefits also differ significantly per market.

“Salary is only the starting point,” says Megan. “We look at which benefits are mandatory in that market and which ones are expected to stay competitive.”

And remember that those benefits can also move with the exchange rate. “Benefits like private medical insurance or pension top-ups are often billed in US dollars, depending on the provider, so your costs move with the exchange rate,” Megan explains.

Check how the role is paid

We’ve used a salaried, full-time Software Engineer as our example, but the maths on total cost can change depending on type of role.

“Some countries also set minimum contributions, which means a part-time or hourly hire can cost you almost as much as a full-time, higher-earning one,” says Megan.

“Variable pay catches people out too. In some markets, bonuses and commissions are taxed at a different rate to base salary, so a commission-heavy sales role can end up far more expensive than the base salary suggests.”

Factor in how you hire

If you’re entering a new market without a local entity, the hiring route adds its own costs.

“If you’re hiring through an Employer of Record, include the service fee, plus the currency conversion margin if your provider charges one,” says Megan. “Also find out whether the country charges VAT on EOR fees. Some do, and that pushes the total up noticeably – companies often budget for the fee and forget the tax on top.”

The same goes for who you’re hiring.

“We also check work eligibility early,” Megan adds. “If the person needs a visa or work permit, that adds cost and time, and it can change whether the hire makes sense at all.”

Finally, to wrap things up, Megan’s advice for anyone building their first total cost of employment view is: “Look past the salary. The gap between what you pay someone and what it actually costs to employ them can be bigger than you’d think, and it comes from contributions, accruals, benefits and fees that aren’t on the offer letter. Map those out country by country before you commit to a location, not after the first invoice arrives.”


Need the total cost of employment for a different role, level, or location?

Use the (free) cost to hire tool

Methodology

Salary figures are Ravio's P50 (median) base salary benchmarks for a P3 (mid-level) software engineer in each country, as of October 2026. Ravio's compensation dataset is drawn from direct HRIS integrations with 1,800+ companies, covering 600,000+ individual compensation data points across European tech.

Employer costs are calculated by Playroll, a global Employer of Record and HR platform. 

They apply each country's employer contribution rates and mandatory or customary employer payments to those P50 salaries. They include statutory contributions (such as social security, pension, health insurance, and unemployment insurance) and other mandatory or customary costs (such as 13th and 14th month payments and holiday pay). They exclude voluntary benefits, employer of record (EOR) fees, recruitment costs, and equipment.

Figures in currencies other than euros are converted at ECB reference rates on 7 October 2026. The Ukrainian hryvnia uses the National Bank of Ukraine's official rate, the UAE dirham its US dollar peg, and the Serbian dinar the National Bank of Serbia's rate. All figures are rounded to the nearest €100.

FAQs

What is total cost of employment?

Total cost of employment is the full annual cost of employing someone. It's their gross salary plus employer costs – social security, pension contributions, insurance, and any mandatory extra payments. According to Ravio and Playroll data, employer costs add between 0% and 70% to a software engineer's salary, depending on the country.

How do you calculate the total cost of an employee?

Start with gross annual salary. Then add the employer contributions the country requires – typically social security, pension, health, unemployment, and accident insurance – plus any mandatory extra payments, like 13th month pay or holiday pay. For a mid-level software engineer in Germany, that's a €78,700 salary plus €16,000 in employer costs, for a total of €94,700.

How much does it cost to employ someone in the UK?

For a mid-level software engineer on the UK median salary of £70,000, employer costs add 16%, or £11,200. Most of that is employer National Insurance (13.9%), with pension auto-enrolment adding 1.9%. The total cost of employment is £81,200.

How much does it cost to employ someone in Germany?

For a mid-level software engineer on Germany's median salary of €78,700, employer costs add 20%, or €16,000. The main costs are pension (9.3%), health insurance (7%), long-term care insurance (1.6%), and unemployment insurance (1.3%). The total cost of employment is €94,700.

How much does it cost to employ someone in France?

For a mid-level software engineer on France's median salary of €68,000, employer costs add 45%, or €30,500. The main costs are pension (16.9%), health insurance (13.5%), family benefits (5.3%), and unemployment insurance (4%). The total cost of employment is €98,500 – €3,800 more than in Germany, despite a salary €10,700 lower.

Which European country has the highest employer costs?

According to Ravio and Playroll data, Italy has the highest employer costs in Europe at 60% of salary, followed by Belgium (59%) and Portugal (50%). In all three, mandatory extra salary payments – such as 13th and 14th month pay – add to already high social security contributions.

Which country has the lowest employer costs?

Singapore has the lowest employer costs in our data, close to 0% of salary for a foreign hire. In Europe, Lithuania and Romania are lowest at 2%, because most contributions there are paid by the employee. Outside Europe, India adds 4%.

Get the Compensation Review straight to your inbox

Your monthly dose of market insights and expert perspectives

You might also like