Top 7 employee benefits benchmarking tools in 2026 (and how to compare them)
Compare employee benefits benchmarking tools, learn what makes benefits benchmark data reliable, and build a more competitive benefits package.

What value do employee benefits actually add to total compensation in European tech?
Most Reward teams benchmark base salaries carefully – but employee benefits tend to get less attention.
In some markets, that's fine.
Statutory systems cover a lot of ground, and what companies offer on top is modest enough that the gap between a good and a poor benefits package doesn't materially shift where you sit in the market.
But in others, benchmarking salary alone gives you a picture that's genuinely incomplete.
A company that thinks it's sitting at the 50th percentile on total comp might be well above or below it once benefits are factored in – depending on where their employees are based.
The problem tends to surface too late: a candidate in Dublin turns down an offer because a competitor's package includes health cover as standard. A new hire in Brussels expects a company car and meal vouchers that weren't in the budget. An existing employee in Germany realises their pension match is half what a peer at another company is receiving.
To understand how significant the gap actually is, we've looked at the monetary value of benefits packages across European tech – what companies are offering, where the value is concentrated, and which markets make benefits benchmarking non-negotiable.
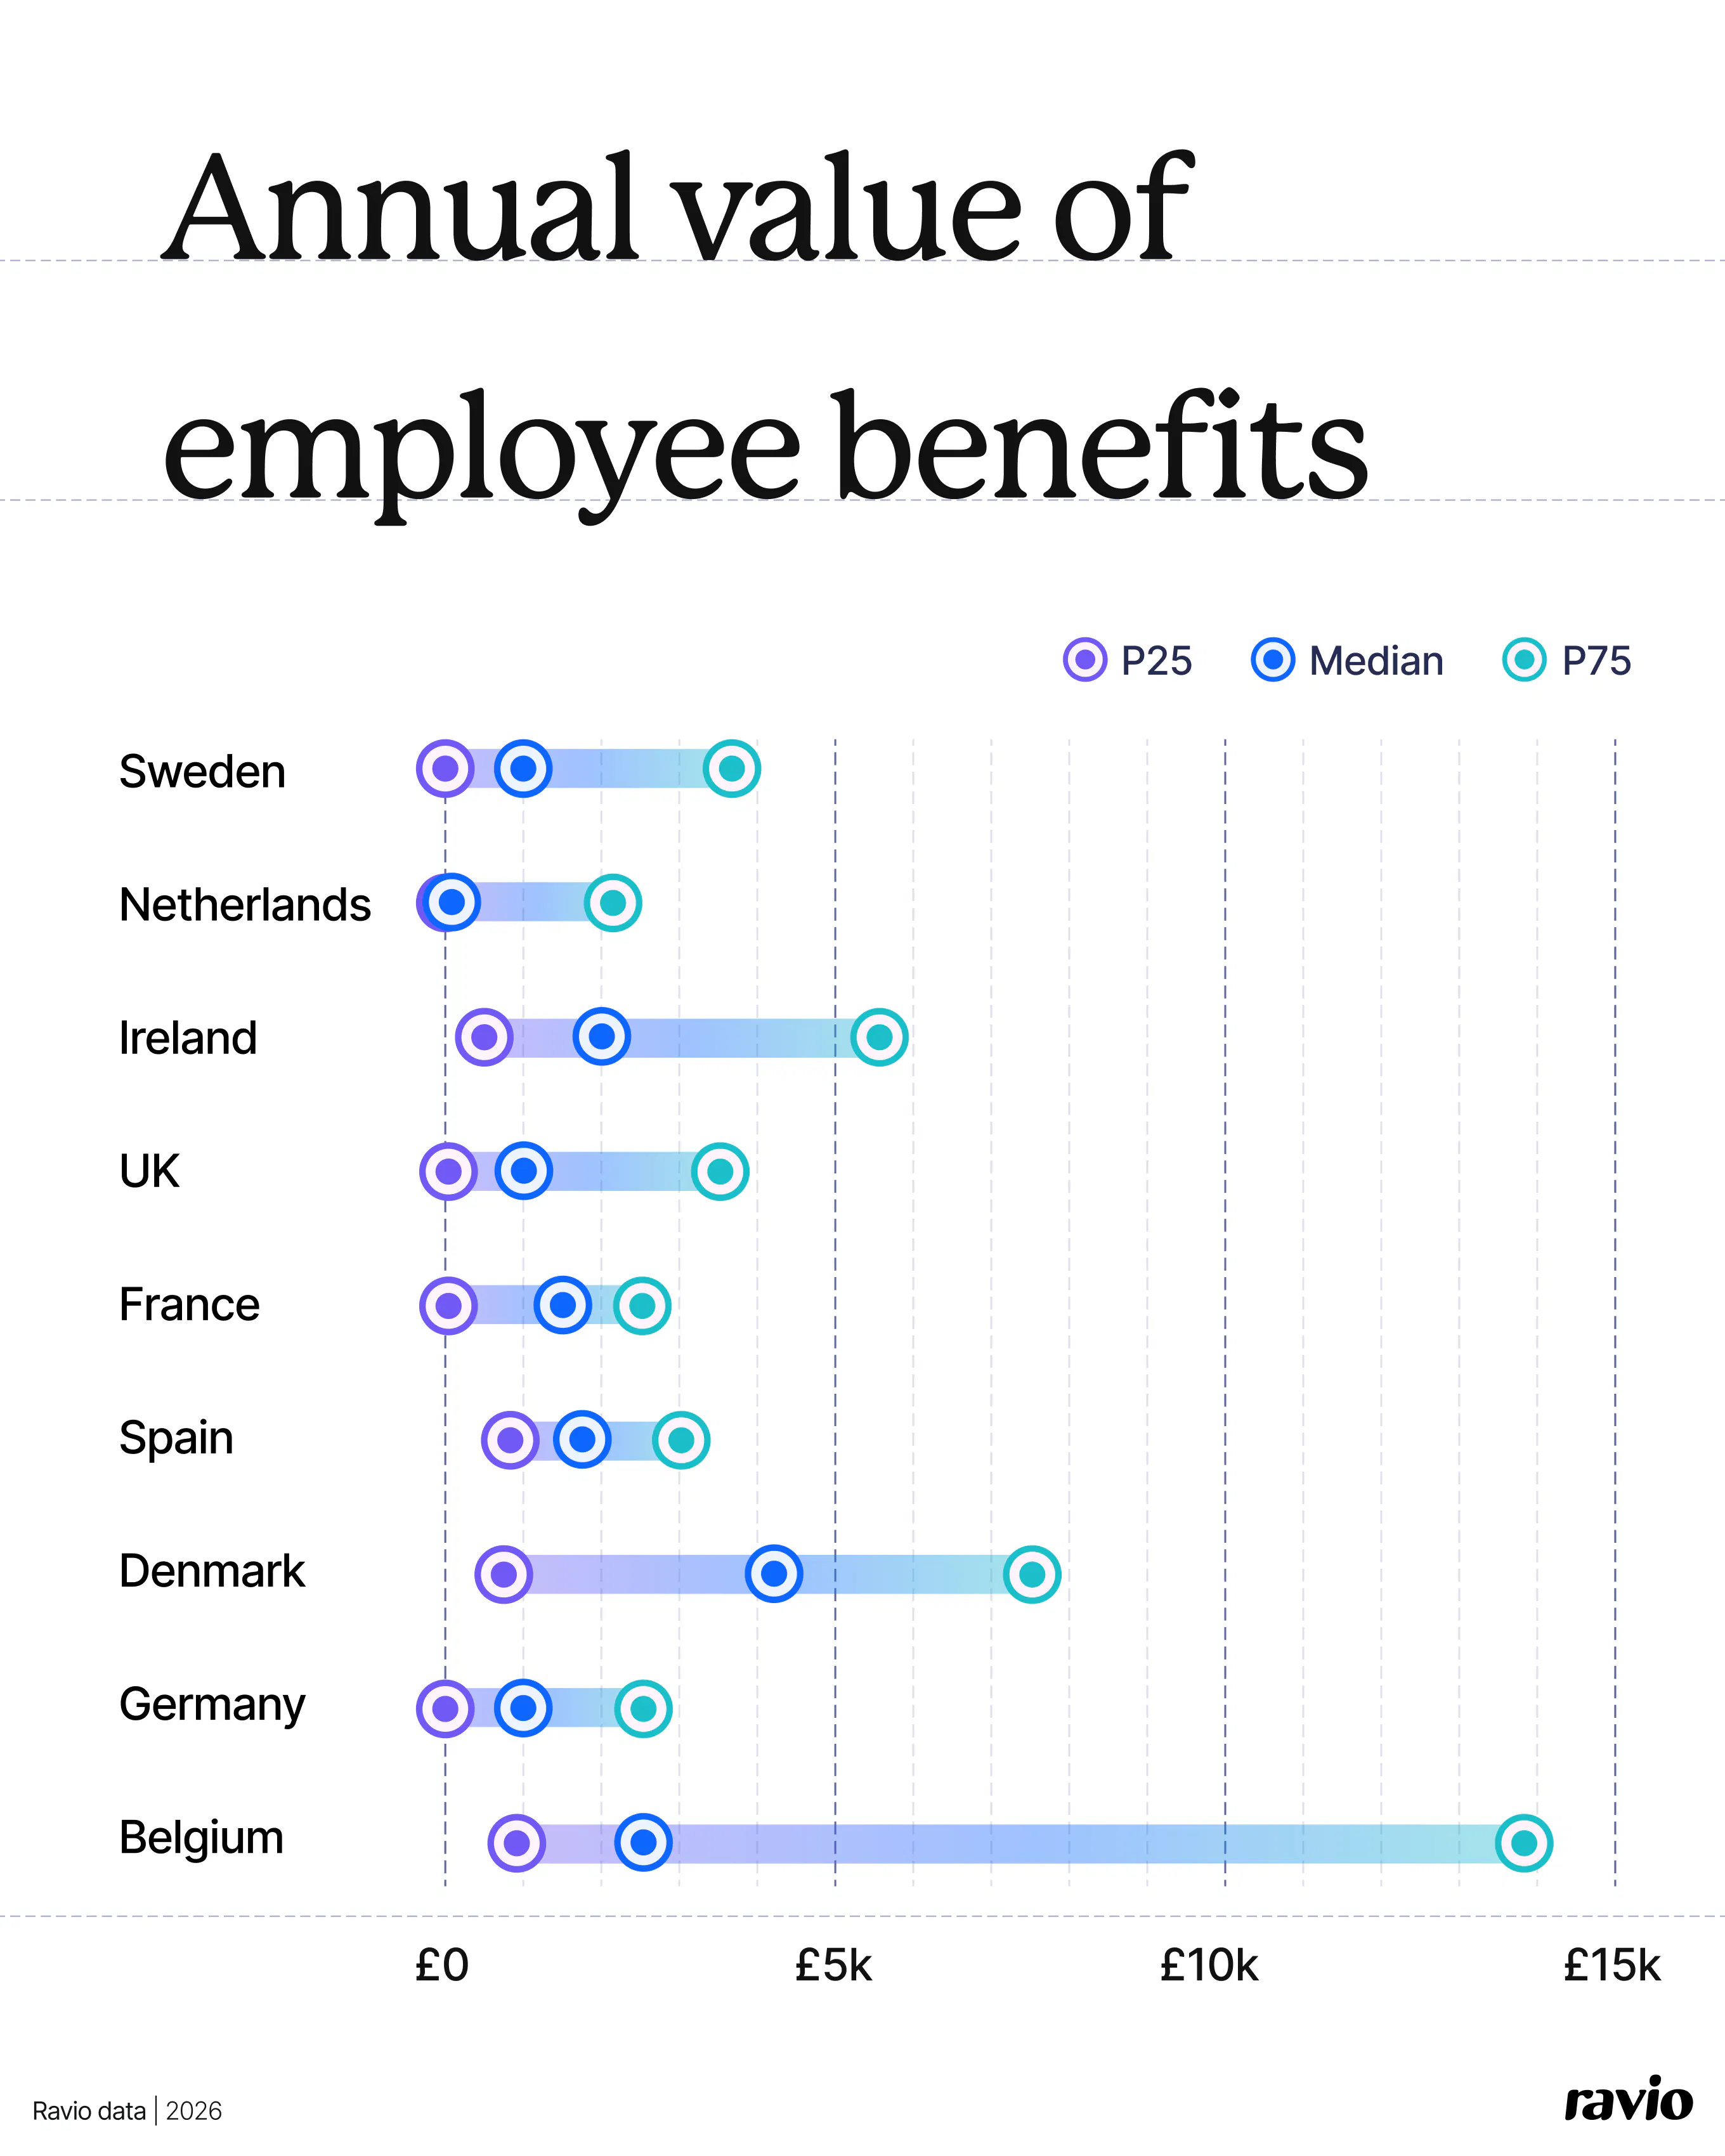
The median annual benefits value across European tech ranges from £0 to £2,600 – depending entirely on where your employees are based.
It's worth noting that these figures reflect what Ravio users report as their benefits value, but there's no single standard for how that's calculated so there’s likely to be a lot of variance – some quantify direct cash benefits like L&D budgets or allowances, others assign a monetary value to non-cash benefits like additional holiday days.

Belgium sits at the top with a median of £2,600, and a range hitting £13,900.
That upper end reflects just how far Belgian employers can go on benefits, driven by the country's tax environment. With some of the highest income tax rates in Europe, benefits are a structurally more efficient way to increase total compensation value – elements like a 13th month salary, double holiday pay, meal vouchers, company cars, and health insurance are widely offered rather than exceptional.
Denmark (£4,300, range £700-£7,400) and Ireland (£2,000, range £400-£5,600) follow.
Denmark's spread is the widest in the dataset – the bottom quarter of employers are offering very little, while the top quarter rival Belgium. Ireland's range is similarly wide, though at a lower level overall: most employers are offering something, but there's no settled norm for how much.
At the other end, the Netherlands shows a median of £0 – but is a market where statutory systems provide comprehensive baseline coverage, meaning private benefits provision from employers is low.
All of this means that if you're managing compensation across multiple European markets, leaving benefits out of your benchmarking will give you an incomplete picture.
A Belgian employee receiving a 13th month salary, holiday pay, a company car, meal vouchers, and health insurance is being compensated very differently to a Dutch counterpart on the same base salary but much lower benefits – and without quantifying that difference, you can't make a meaningful comparison.
Let’s take a look at some specific examples to see how benefits provision varies across Europe.
Three of the most monetarily significant benefits are company cars and mobility support, health insurance, and pension contributions – and how each varies across Europe tells its own story.
Company car provision is where some of the starkest country-level variation sits.
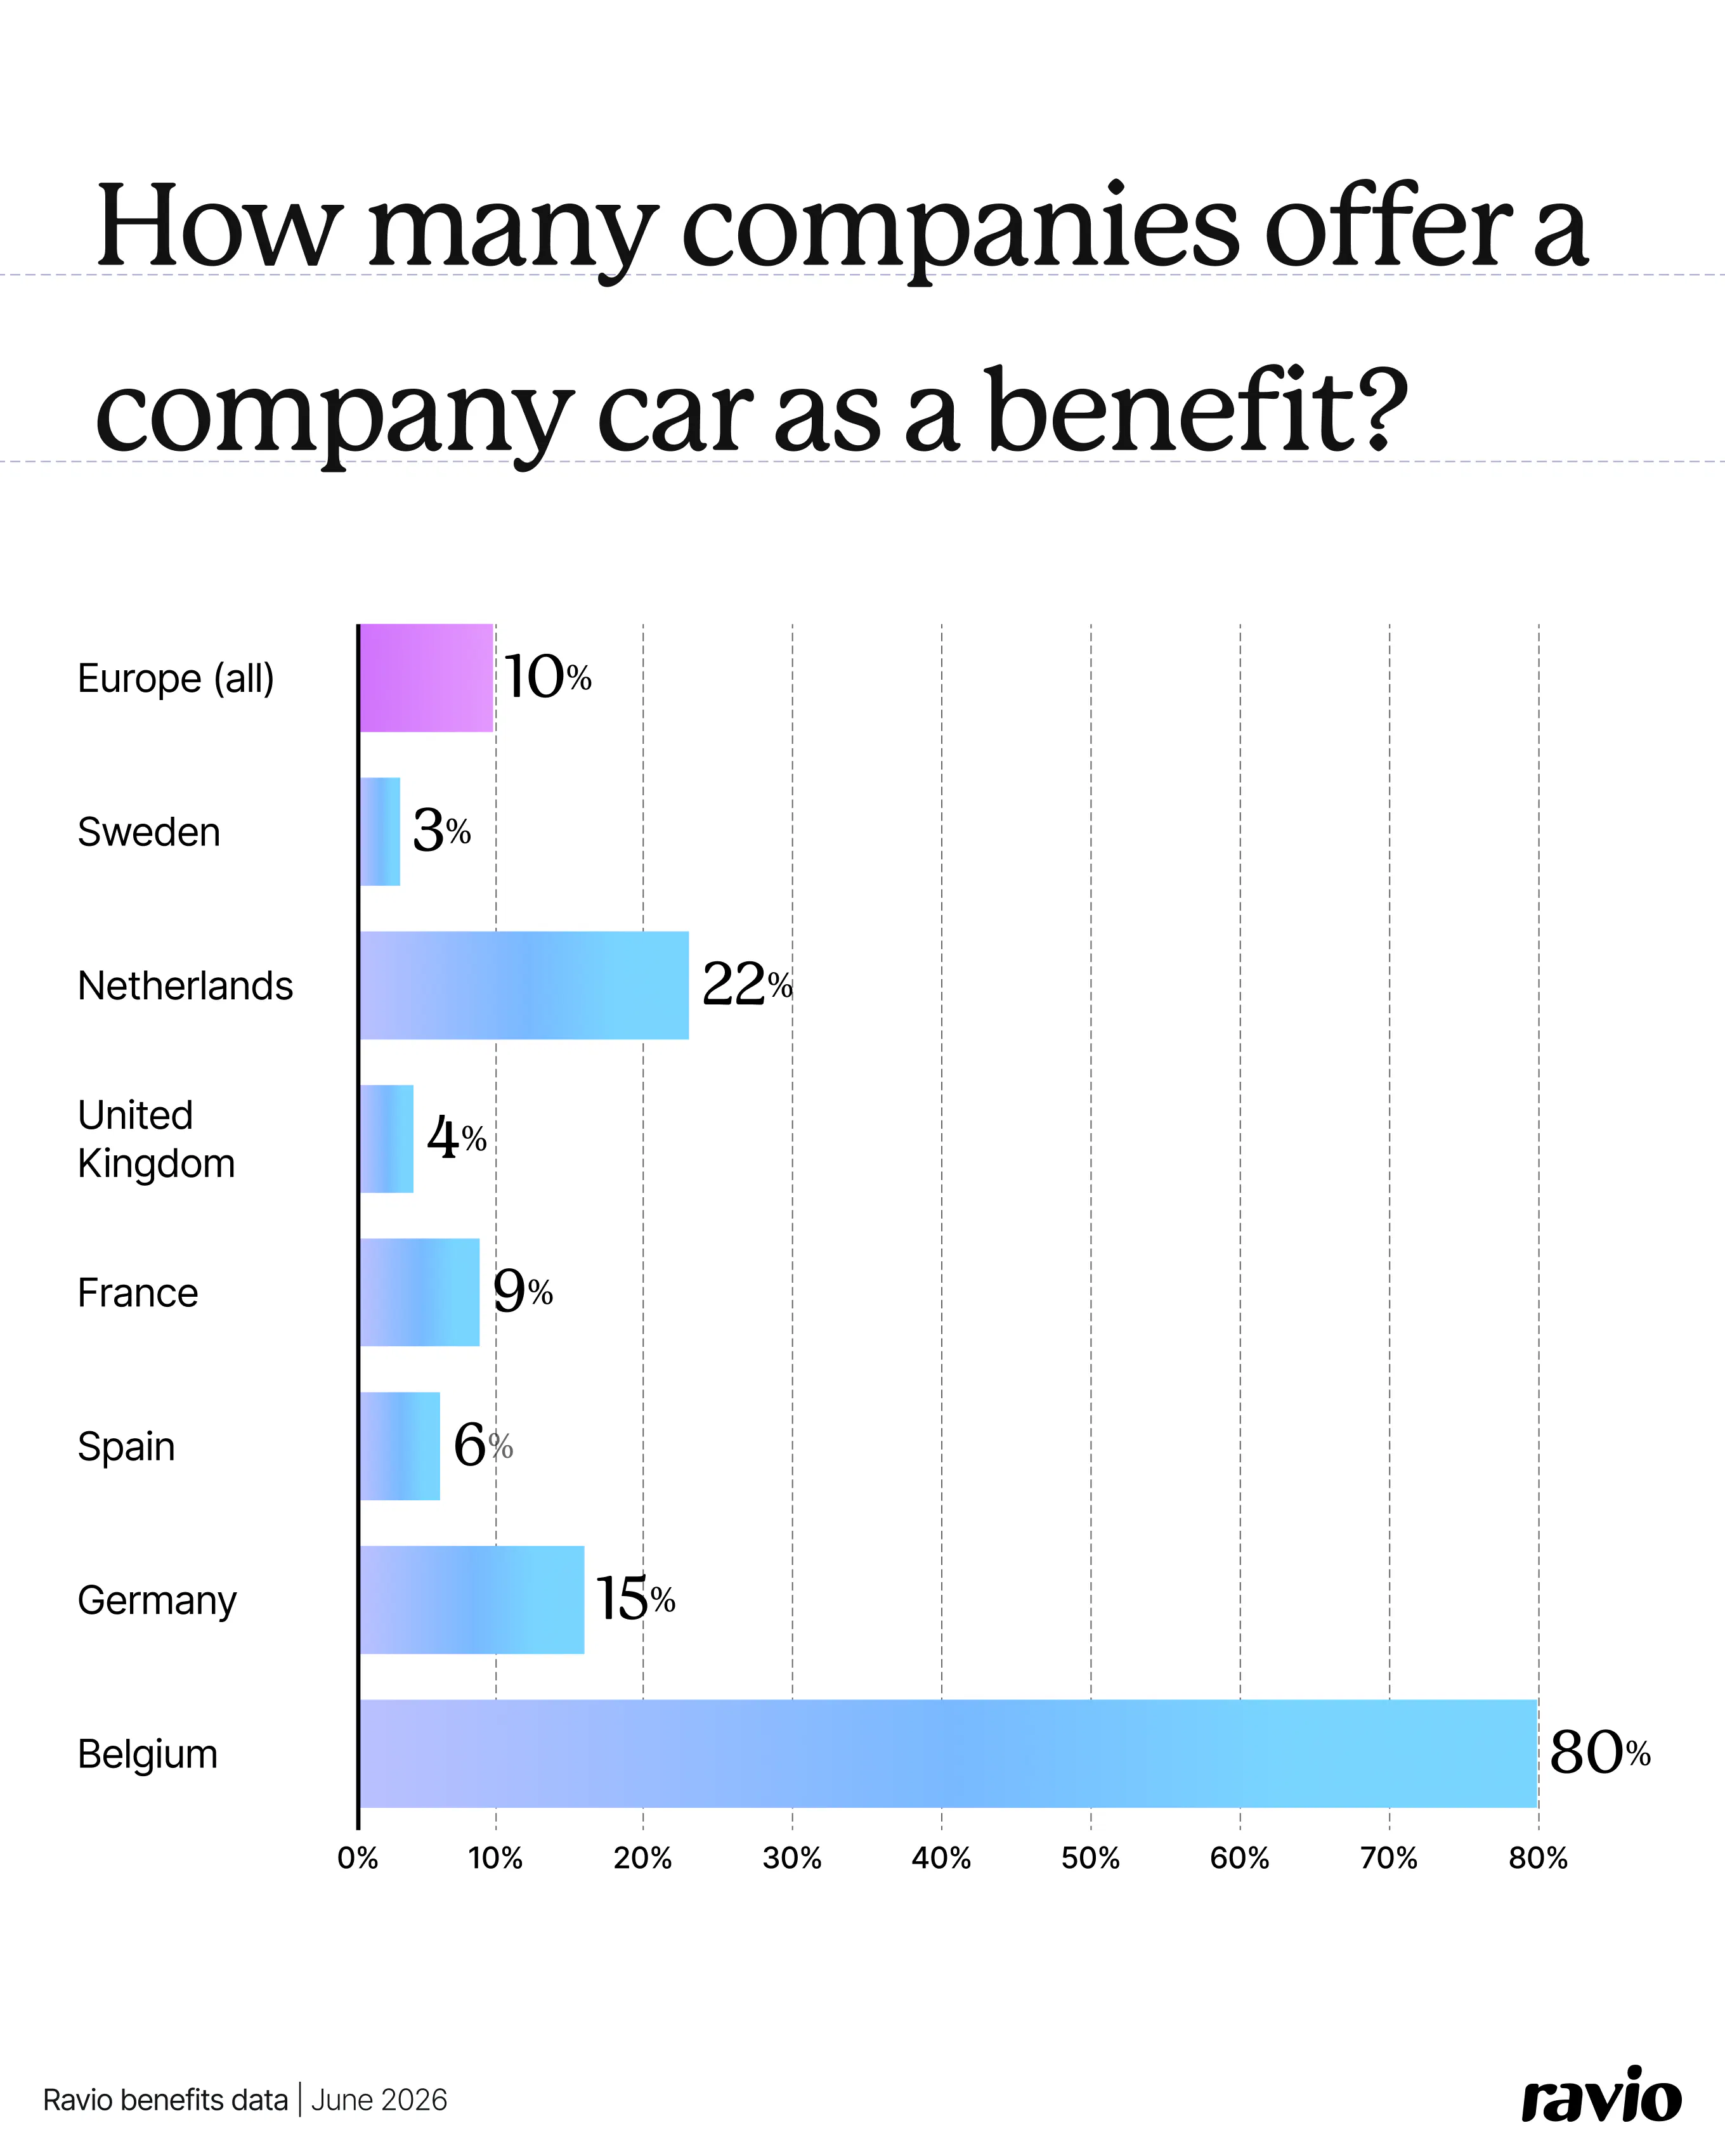
Across European tech overall, 10% of companies offer a company car – but at a country-by-country level there’s a huge range.
In Belgium, 80% of tech companies offer a company car – a direct consequence of how the tax system works there, making it more efficient to increase total compensation via benefits than base salary.
In Germany it's 15%, the Netherlands 22%.
In the UK, Sweden, and most other markets, it's in low single digits.

Health insurance prevalence shows an equally wide spread across Europe.
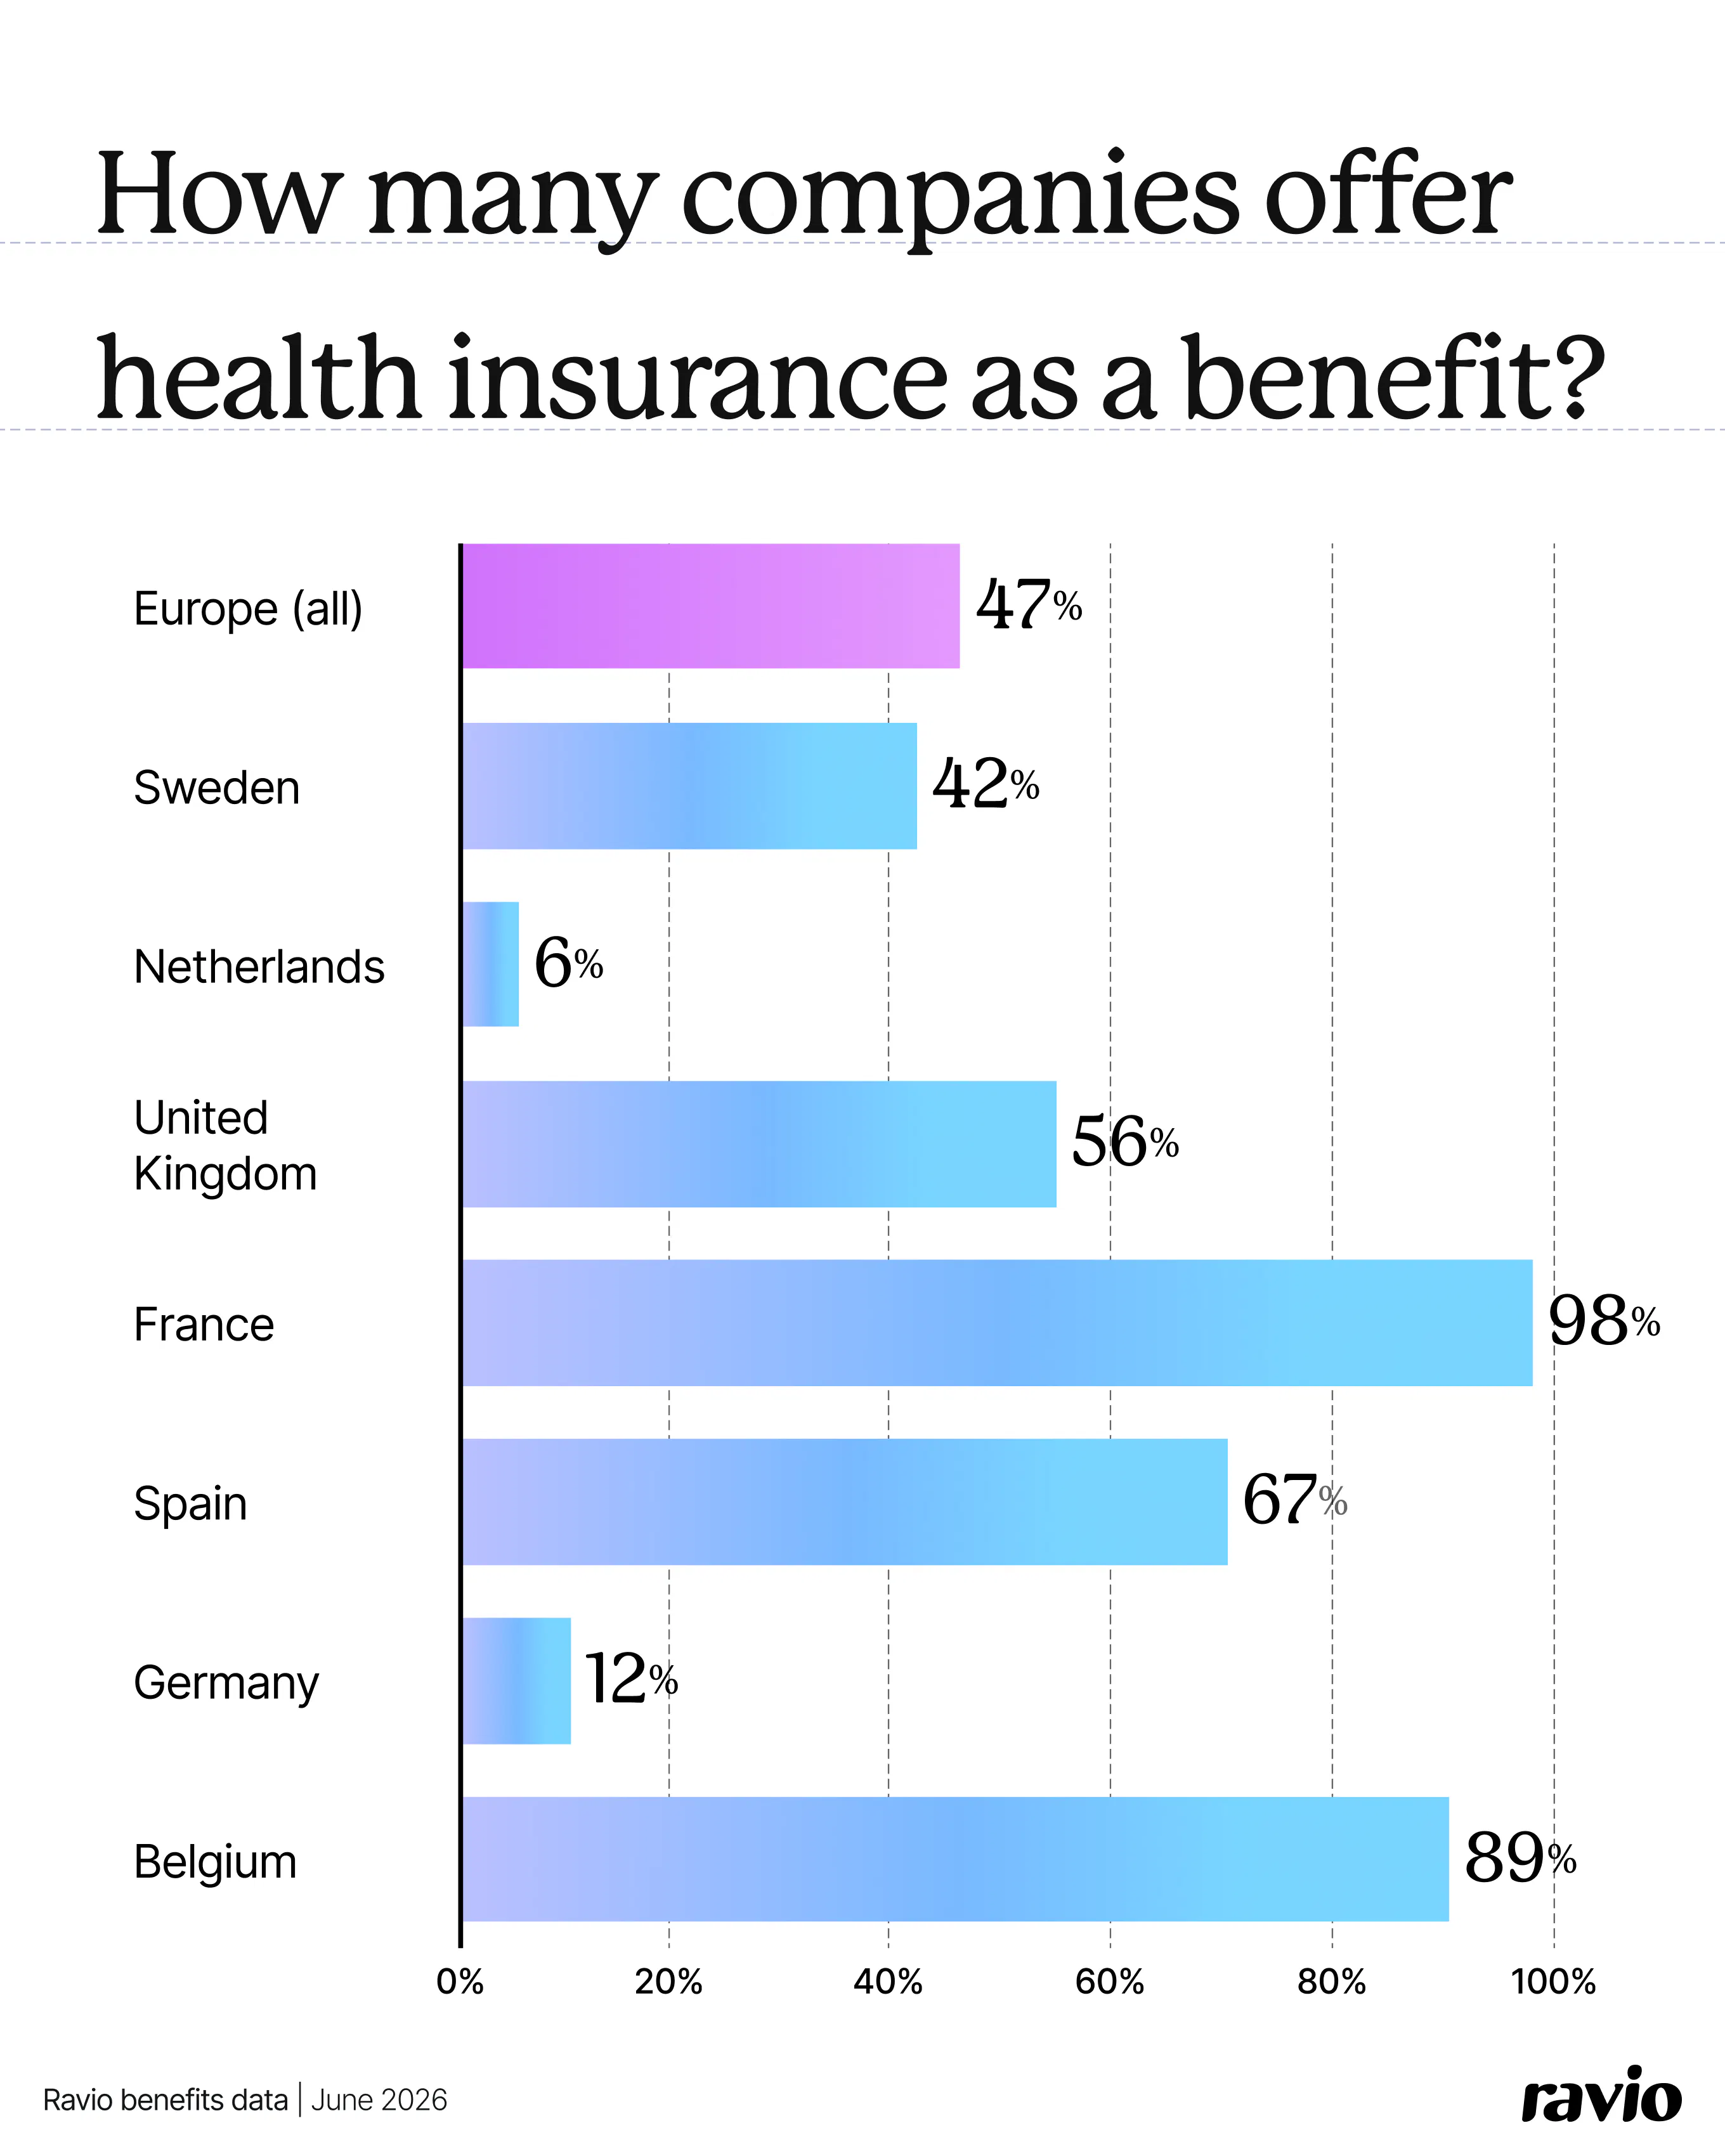
France has the highest rate of employer-provided health insurance at 98%.
The Netherlands has the lowest at 6%, with Germany not far behind at 12%.

That isn't just because French employers are more generous – it's because French law mandates a supplementary health contribution (the mutuelle) from employers. It’s interesting, then, that it isn’t 100% – but this likely reflects user interpretation of the survey questions.
On the other hand, the low rates in the Netherlands and Germany reflects a statutory system that already provides comprehensive health coverage, leaving less of a gap for employers to fill.
For Reward teams, a health insurance benefit means something very different depending on where an employee is based – in France it's a compliance obligation, in Ireland it's a differentiator.
Benchmarking the presence of health insurance (or comparing an overall benefits package) without that location context tells you very little.
Employer pension contribution rates also vary significantly across Europe – and, as with health insurance, a lot of that fluctuation has to do with local legislation on statutory requirements.
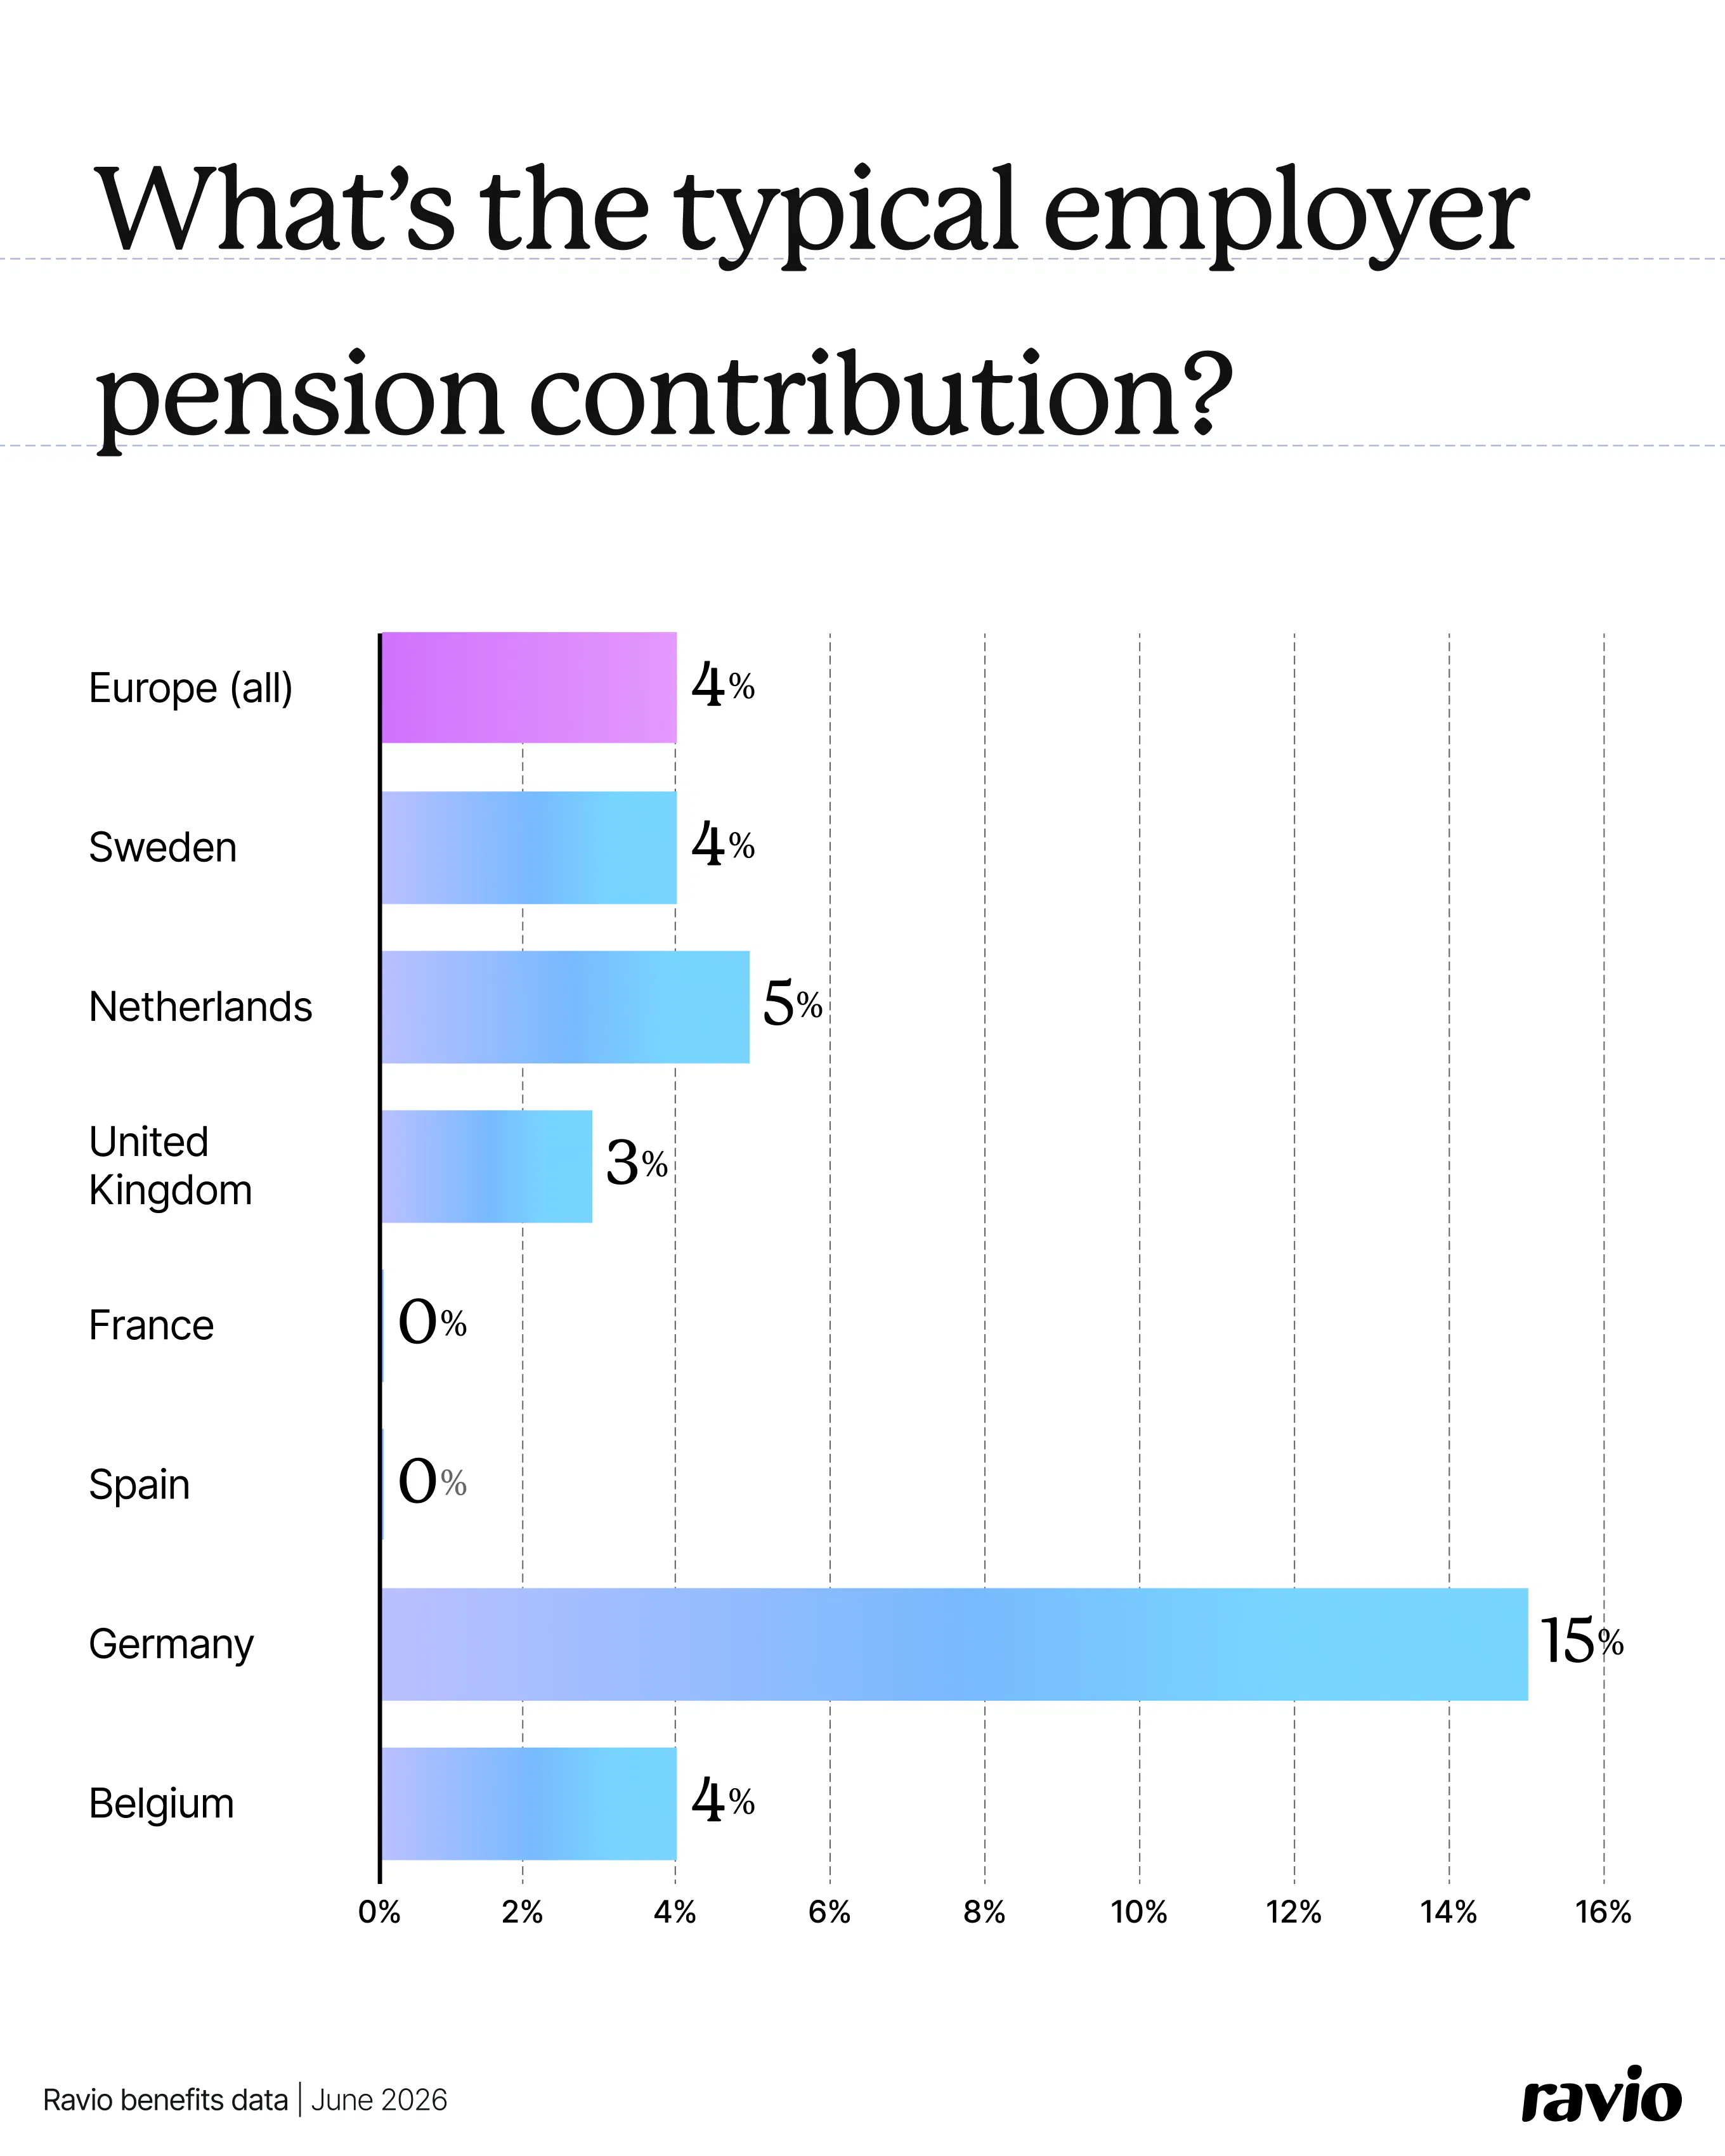
Germany stands out with a 15% median employer pension match, well above every other market. But, this actually reflects statutory local requirements – since 2019, German employers have been required to contribute at least 15% of the employee’s pension contribution.
The Netherlands and Denmark cluster around 5%. The UK and Ireland are at 3-4%.
France, Spain, Portugal, and Austria show 0% median employer contributions. This likely reflects mandatory state pension systems funded through social security contributions rather than separate employer matching – like in France, where employers are already required to contribute to both basic and supplementary pensions via payroll.

The variation in benefits value across European tech is significant, and it reflects statutory systems, tax frameworks, and local norms that differ significantly by market.
This is why it's so vital to include employee benefits in your compensation benchmarking, to understand what benefits are typically offered, and what they're worth in monetary terms – a benchmarking provider like Ravio that includes benefits market data makes this possible.
Salary benchmarking tells you part of the story – and in markets like the Netherlands or Switzerland, where statutory provision is strong and private benefits modest, it tells you most of it.
But in markets like Belgium, Ireland, and Austria – where benefits are a material component of total comp – benchmarking salary (or even total cash) alone will give you a misleading read on where you actually stand.
Of course, alongside the market data, you also need the understanding of what's driven by local law versus employer choice. A 15% pension contribution in Germany and 98% health insurance prevalence in France look like generous employer decisions – but both are largely statutory.
The harder question is what you do with that information.
Do you accept that benefits value will look different market by market – a company car in Belgium, a higher pension match in Germany – and benchmark each location on its own terms? Or do you try to equalise total comp value across markets, offsetting lower benefits in some locations with higher salary?
There's no universal answer, it all depends on your own compensation philosophy and location pay approach – but it's a decision that's impossible to make well without first understanding what benefits are worth in each market you operate in.
Benefits data is collected directly through the Ravio platform, and the sample here is from over 2,000 companies between November 2022 to June 2026. These companies represent over 300,000 employees.
Percentages for benefits in each country are defined by calculating the total number of companies that offer that benefit, divided by all the other companies that have provided benefits information within that country.
Your monthly dose of market insights and expert perspectives

Compare employee benefits benchmarking tools, learn what makes benefits benchmark data reliable, and build a more competitive benefits package.

Handpicked Berlin and Ravio are unpacking five findings from the 2026 Berlin Tech Salary Survey – with European benchmark data added in real time.

AI compensation and hiring trends: 88% growth in AI hiring, 12% salary premiums, and how demand for AI skills is reshaping the tech talent market.