
Pay equity
Women in tech statistics 2026: the representation gap driving pay inequity
Women make up 36% of the European tech workforce in 2026, but just 22% of executives and 25% of top earners. See the latest women in tech statistics.


First published: October 2025
Last updated: 4 November 2026
Despite growing awareness and regulatory pressure from the EU Pay Transparency Directive, the gender pay gap continues across all major tech markets in Europe.
Ravio's 2027 Compensation Trends report analysed salary data from 1,600+ European tech companies to understand the current state of gender pay equality.
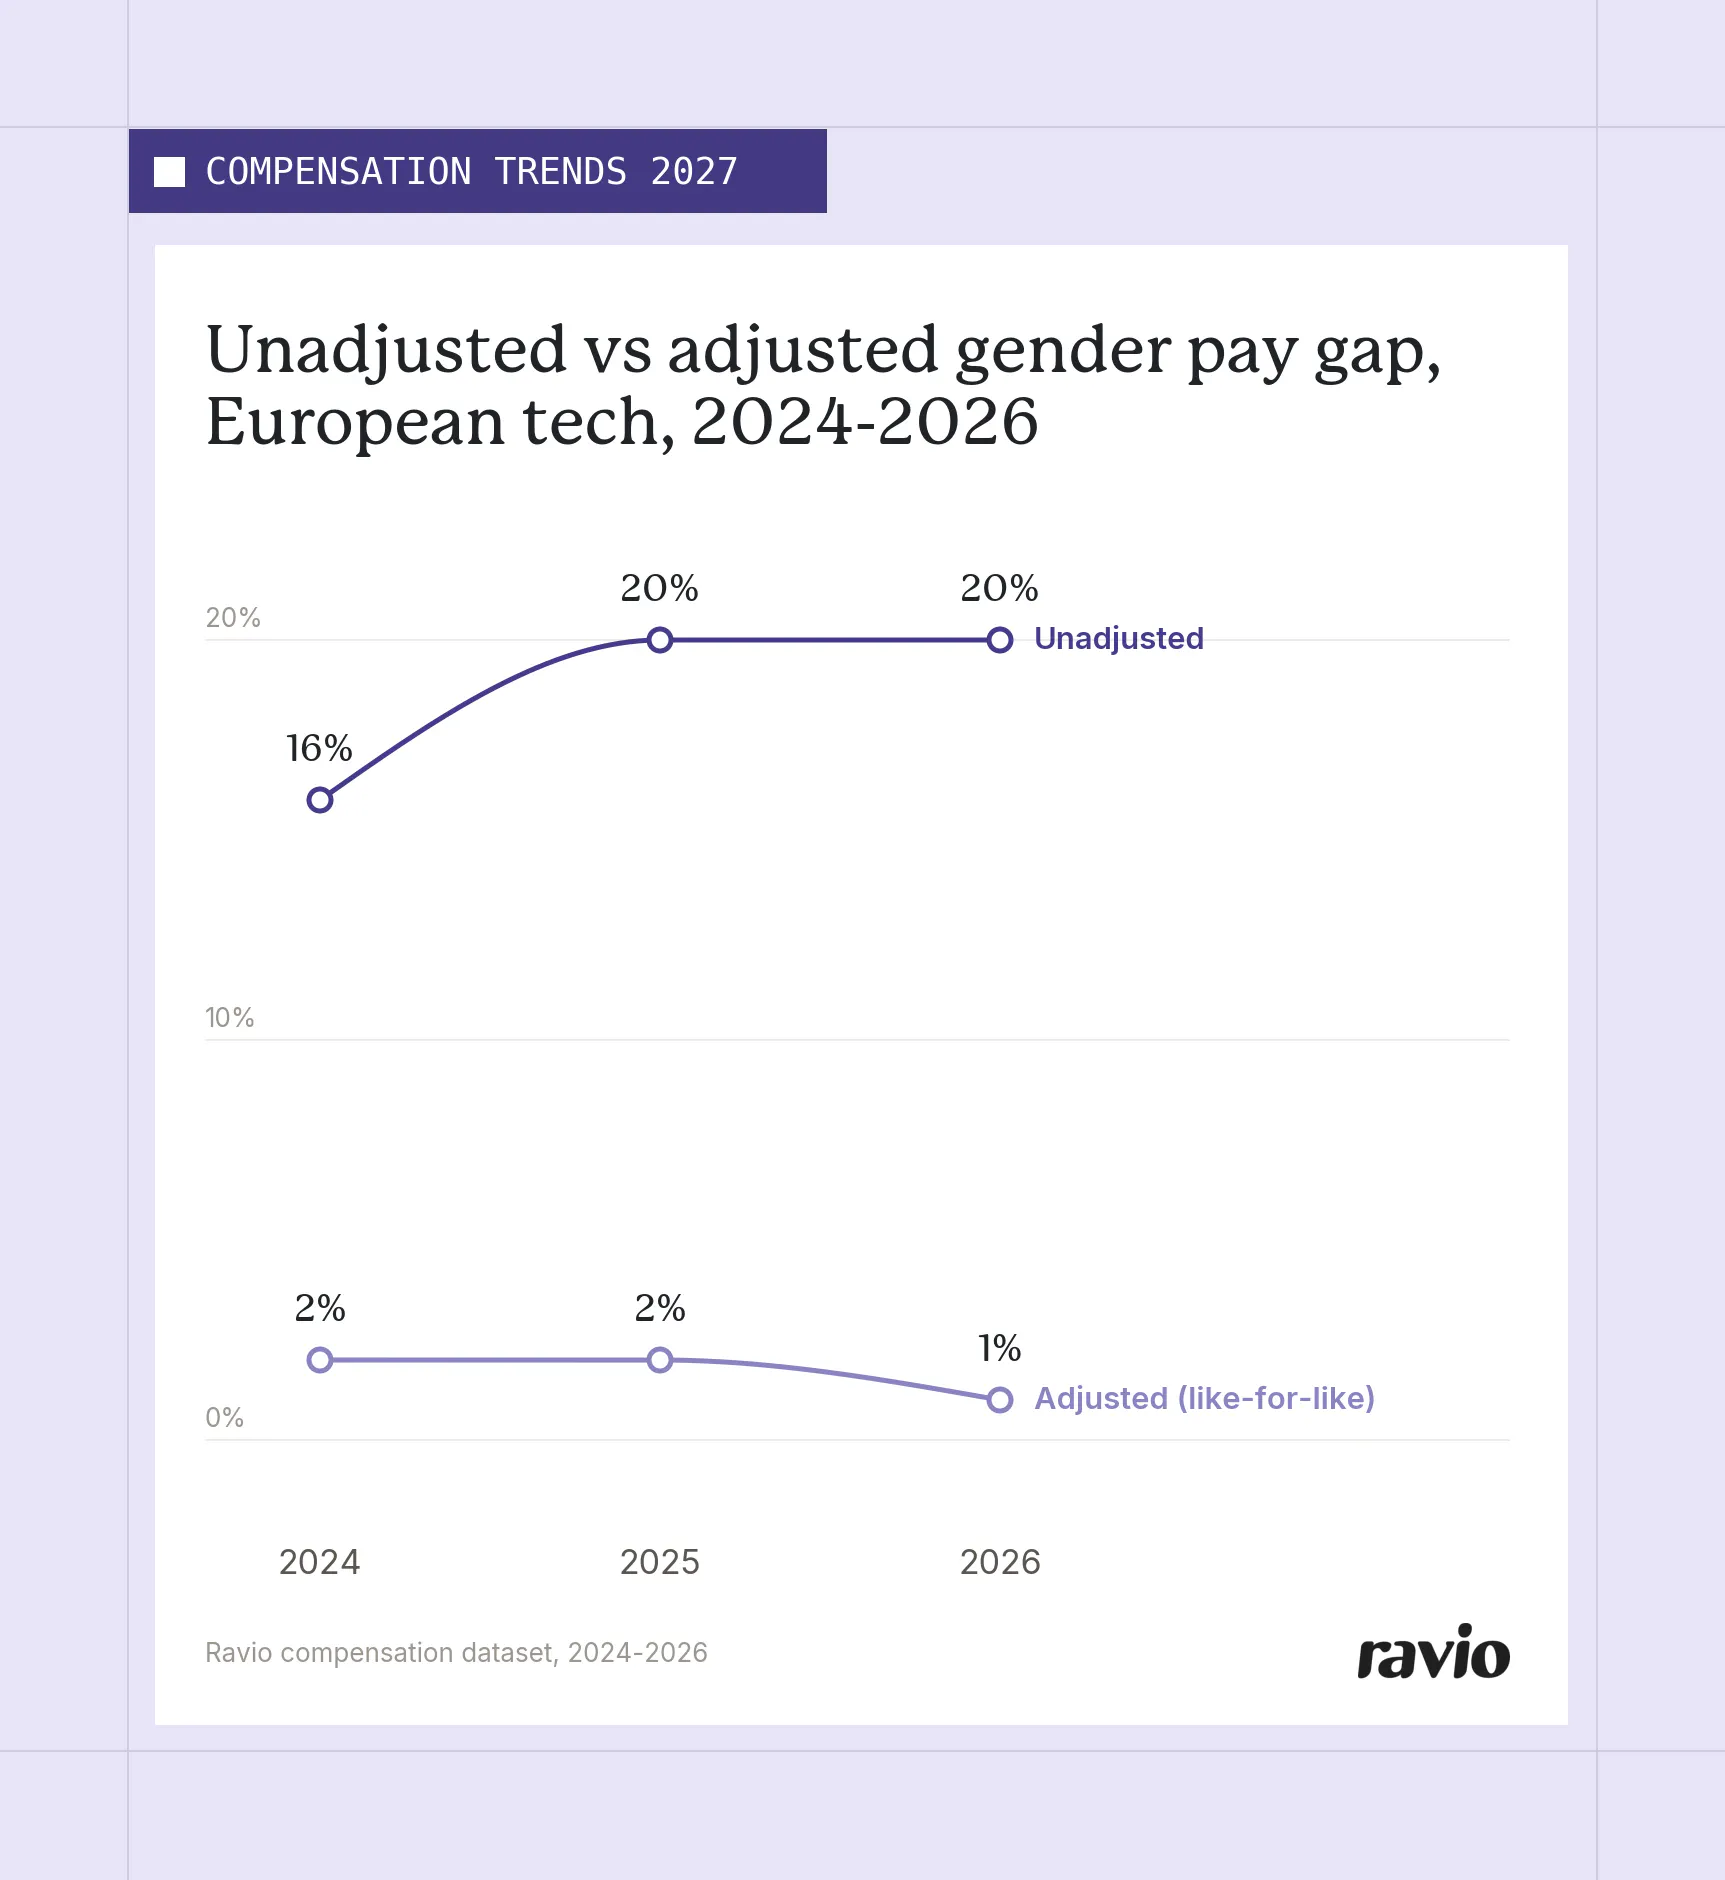
The findings: a 20% unadjusted gender pay gap and a 1% adjusted gap across European tech in 2026 – with women paid close to equally for the same role, but still far less likely to be in the highest-paid roles.
Quick answers: the gender pay gap in 2026
Just looking for the data? Here’s the TLDR:
Source: Ravio Compensation Trends 2027 – live data from 1,800+ companies and 618,000+ employee datapoints, plus a survey of 150 People and Reward Leaders.
The gender pay gap in European tech is 20% unadjusted and 1% adjusted in 2026 (source: Ravio Compensation Trends 2027).
2024 | 2025 | 2026 | |
|---|---|---|---|
Unadjusted gender pay gap | 16% | 20% | 20% |
Adjusted gender pay gap | 2% | 2% | 1% |
These two measures tell different but complementary stories about pay inequality:
The unadjusted gap hasn't moved in the last 12 months.
But with pay for the same role at the same level now close to equal, the headline 20% is being driven by where women are in the workforce, not by what they're paid once they're there.
The representation of women remains the core challenge for pay equity.
Engineering has by far the largest gender pay gap of any function in tech, at 21% unadjusted and 5% adjusted (source: Ravio Compensation Trends 2027).
Function | Unadjusted gap, 2026 (2025) | Adjusted gap, 2026 (2025) |
|---|---|---|
Engineering | 21% (22%) | 5% (4%) |
Marketing | 12% (7%) | 3% (3%) |
Product | 11% (11%) | 2% (3%) |
People | 7% (-1%) | -2% (4%) |
Sales and Relationship Management | 7% (6%) | 1% (0%) |
Operations | 5% (3%) | 0% (1%) |
People and Marketing, historically two of the most equal functions, both saw big increases in the unadjusted gap this year.
In Marketing, the unadjusted gap widened to 12% while the adjusted gap held at 3% – suggesting more men are reaching senior Marketing roles, rather than unequal pay for the same job.
Engineering's gap is driven by both representation and pay: women make up just 19% of Engineering, and it also has the highest adjusted gap of any function.
The unadjusted gender pay gap ranges from 13% in Sweden to 23% in the UK, while the adjusted gap ranges from 0% (UK and Spain) to 4% (Netherlands) (source: Ravio Compensation Trends 2027).
Country | Unadjusted 2025 | Unadjusted 2026 | Adjusted 2025 | Adjusted 2026 |
|---|---|---|---|---|
UK | 19% | 23% | 1% | 0% |
Germany | 13% | 16% | 1% | 2% |
France | 17% | 16% | 2% | 2% |
Spain | 19% | 16% | 2% | 0% |
Netherlands | 13% | 15% | -1% | 4% |
Sweden | 17% | 13% | 4% | 1% |
The gender pay gap climbs through the individual contributor levels, peaks sharply at M2 (Manager) at 15%, then narrows again at senior management and executive level (source: Ravio Compensation Trends 2027).
The step into line management is where the widest pay disparity shows up – so it's an area to pay particular attention to.
Job level is also a useful starting proxy for the EU Pay Transparency Directive's "work of equal value" categories – so this analysis can be used as a starting point to see where the biggest risks lie.
Job level | Unadjusted gap, 2026 |
|---|---|
P1 | 2% |
P2 | 6% |
P3 | 8% |
P4 | 6% |
P5 | 2% |
P6 | 5% |
M1 | 5% |
M2 | 15% |
M3 | 11% |
M4 | 9% |
M5 | 8% |
Executive (all levels) | 3% |
Women hold just 22% of executive roles – and those who do are paid less across every part of the package.
Female executives earn 3-8% less in base salary, 21-28% less in bonus, and 18-27% less in annual equity value than male peers, with the gap widening at C-level (source: Ravio Compensation Trends 2027).
Median, 2026 | VP – men | VP – women | C-level – men | C-level – women |
|---|---|---|---|---|
Base salary | £175,500 | £169,500 | £194,900 | £180,000 |
Annual bonus | £57,900 | £41,700 | £68,700 | £53,900 |
Annual equity value | £50,000 | £40,750 | £125,000 | £91,600 |
There are many structural reasons that drive the gender pay gap – but three key patterns emerge in the European tech sector: representation, hiring practices, and the broader structural challenges women face balancing careers with caregiving responsibilities.
The biggest driver of the gender pay gap is representation.
Women make up just 36% of the European tech workforce overall, and – most significantly – hold just 22% of executive roles.
This dramatic drop-off at senior levels drives up the unadjusted pay gap, creating a structural imbalance where fewer women have access to the highest-paying roles in tech. For the full data, see our guide to women in tech statistics.
Reward Leaders recognise this: when asked what drives their own gender pay gap, the most common answers are underrepresentation of women in senior roles (36%) and in higher-paying functions like Engineering (26%).
What do you see as the biggest driver of your gender pay gap? | % of respondents |
|---|---|
Underrepresentation of women in senior/leadership roles | 36% |
Unsure | 26% |
Underrepresentation of women in higher-paying functions (e.g. Engineering) | 26% |
Lack of evaluation on the business value of different roles | 5% |
Manager bias and discretion during hiring | 4% |
Manager bias and discretion during comp reviews | 3% |
But representation is only part of the picture. Matt McFarlane, Director at FNDN, has seen companies stop at reporting.
"I'm seeing companies publishing their data and checking the compliance box, but not addressing root causes," he says.
"Transparency alone doesn't fix systematic pay equity issues – it's the promotion patterns, role levelling inconsistencies, negotiation biases, and so on that we need to look deeper into."
Where adjusted gaps exist, they're often introduced when someone is hired – through lower starting offers, negotiation dynamics, or recruitment that relies on male-dominated networks – rather than through later pay rises.
That's why removing salary history questions (now required under the EU Pay Transparency Directive) and setting offers against consistent salary ranges matter so much.
Ravio's 2024 pay equity analysis also found that men and women have similar rates of promotion (around 7-8%) and pay increases (around 23%) – so, in that analysis, gender pay inequality had to exist from the start of employment, rather than being introduced as employees progress.
This points to issues in hiring practices rather than bias in internal progression, with factors like recruiting bias and salary negotiation shaping the starting salary that men and women receive for equal work.
Women continue to shoulder more unpaid care work than men, which impacts their career trajectories.
Research shows that mothers are much more likely than fathers to reduce working hours or withdraw from full-time employment after having children, creating career interruptions that compound over time into significant differences in pay.
Whilst tech companies often offer more progressive parental leave policies than traditional sectors, the structural challenge remains: women are more likely to take extended time away from work and to manage ongoing caregiving responsibilities alongside their careers, which can limit progression opportunities into more senior, higher-paying roles.
Concerningly, 44% of companies took no specific action on their gender pay gap in the last 12 months. Where they did, adjusting individual salaries to close identified gaps was the most common lever (34%) (source: Ravio Compensation Trends 2027).
Actions taken to reduce the gender pay gap in the last 12 months | % of respondents |
|---|---|
No specific action taken | 44% |
Adjusted individual salaries to close identified gaps | 34% |
Introduced more compensation structure to reduce inconsistencies | 21% |
Introduced more structured hiring ranges to reduce negotiation bias | 15% |
Changed promotion/hiring practices to address representation | 8% |
That's a notable mismatch.
Most companies say representation is the root cause, yet the most common action treats the symptom (individual salaries) rather than the structural cause – just 8% changed promotion or hiring practices.
"Adding a bit more money to the salary increase budget is an easy box to tick, and it’s our role to make sure that extra budget actually helps close pay gaps for women," says Liis Reitz, Compensation Specialist at SMG Swiss Marketplace Group. "But budget alone doesn’t fix the underlying problem."
Only 30% of companies have calculated and documented their gender pay gap by worker category, and 17% have a remediation plan for identified gaps.
EUPTD readiness: what's already in place? | % of companies |
|---|---|
Salary bands/ranges documented for all roles | 63% |
Removed pay history questions from recruitment | 54% |
Established gender-neutral job evaluation framework | 46% |
Pay ranges included in hiring process | 43% |
Internal communications planned or in progress | 35% |
Worker categories defined based on work of equal value | 34% |
Established employee pay information request process | 33% |
Gender pay gap calculated and documented by worker category | 30% |
Remediation plan in place for identified pay gaps | 17% |
Nothing in place yet, actively working on it | 12% |
Nothing in place yet, not prioritising it | 7% |
Not applicable | 15% |
The biggest barrier by far is waiting for local law to be finalised (52%), while 27% say they're on track (source: Ravio Compensation Trends 2027).
Biggest barrier to EUPTD readiness | % of companies |
|---|---|
Waiting for local law to be finalised | 52% |
No significant barrier – on track | 27% |
Data/systems not set up to report on this | 8% |
Concern about what the data will reveal | 6% |
Lack of internal resource or budget | 4% |
Lack of senior leadership prioritisation | 4% |
For companies across several countries, Andreea Lupu, Compensation & Benefits Architect at Meaningful, recommends not waiting.
"We're taking the transposition with the strictest requirements and applying that everywhere," she says. "It's easier to start strict than to have to change the whole approach later."
And don't leave communication until last.
"If your managers don't understand what to do once it hits operations, you can very easily become non-compliant without realising it," says Becky Hewson-Haworth, Pay Transparency & Reward Communications Consultant.
Begin your journey towards EUPTD compliance
With Ravio’s EU pay transparency analysis tool, you can draft your equal value categories, calculate your gender pay gap per grouping, and use regression analysis to understand what’s driving gaps.
The gender pay gap is the difference in earnings between men and women. The unadjusted gender pay gap compares all men and women regardless of role or seniority, whilst the adjusted gender pay gap compares men and women in the same role at the same level.
The unadjusted gender pay gap is calculated by comparing median earnings between all men and all women. The adjusted gender pay gap uses regression analysis to account for factors like location, job function, and seniority level, enabling a like-for-like comparison of equal pay for equal work. See our full guide to gender pay gap calculations.
In 2026, the gender pay gap in European tech is 20% (unadjusted) and 1% (adjusted for factors like role, level, and location). The UK has the highest unadjusted gap at 23%, and Sweden the lowest at 13%. For adjusted gaps, the Netherlands is highest (4%) and the UK and Spain lowest (0%).
In European tech, the gender pay gap is 20% unadjusted and 1% adjusted in 2026. Engineering has the largest gap of any function, at 21% unadjusted and 5% adjusted (Ravio Compensation Trends 2027).
A major driver behind the gender pay gap is the underrepresentation of women in senior positions – women hold just 22% of executive roles in European tech despite making up 36% of the workforce. Pay gaps are also introduced at the point of hire through bias in compensation decisions, and women's disproportionate caregiving responsibilities can limit career progression into higher-paying roles.
Yes. Ravio’s data shows a 20% unadjusted gender pay gap and 1% adjusted gender pay gap in European tech in 2026. Whilst the gap between these figures reveals that representation is the primary driver rather than unequal pay for identical work, both measures demonstrate that women earn less than men across the industry.
Yes. The UK has a 23% unadjusted gender pay gap and 0% adjusted gender pay gap in tech (Ravio 2027 Compensation Trends report). The adjusted gap suggests equal pay for equal roles, but the unadjusted gap – the highest of six European markets – reflects poor representation of women in senior, higher-paid positions.
Closing the gender pay gap requires addressing three key areas: improving representation of women in senior positions through targeted hiring and promotion practices, eliminating bias in compensation decisions at the point of hire by using objective data and removing salary history questions, and providing better support for working parents to ensure caregiving responsibilities don't limit career progression.
Your monthly dose of market insights and expert perspectives
Women make up 36% of the European tech workforce in 2026, but just 22% of executives and 25% of top earners. See the latest women in tech statistics.

How is the gender pay gap calculated? Step-by-step median and mean formulas with a worked example, the adjusted vs unadjusted gap explained, and what the EU Directive requires.

A complete guide to pay transparency in France: current law, what the EU Directive changes, how France's draft transposition bill goes further, and how to prepare for compliance.

