
Pay equityRavio updates
How Ravio helps you identify and close pay gaps
Use Ravio to identify pay gaps across your organisation, understand what's driving them, and calculate the cost of closing them.
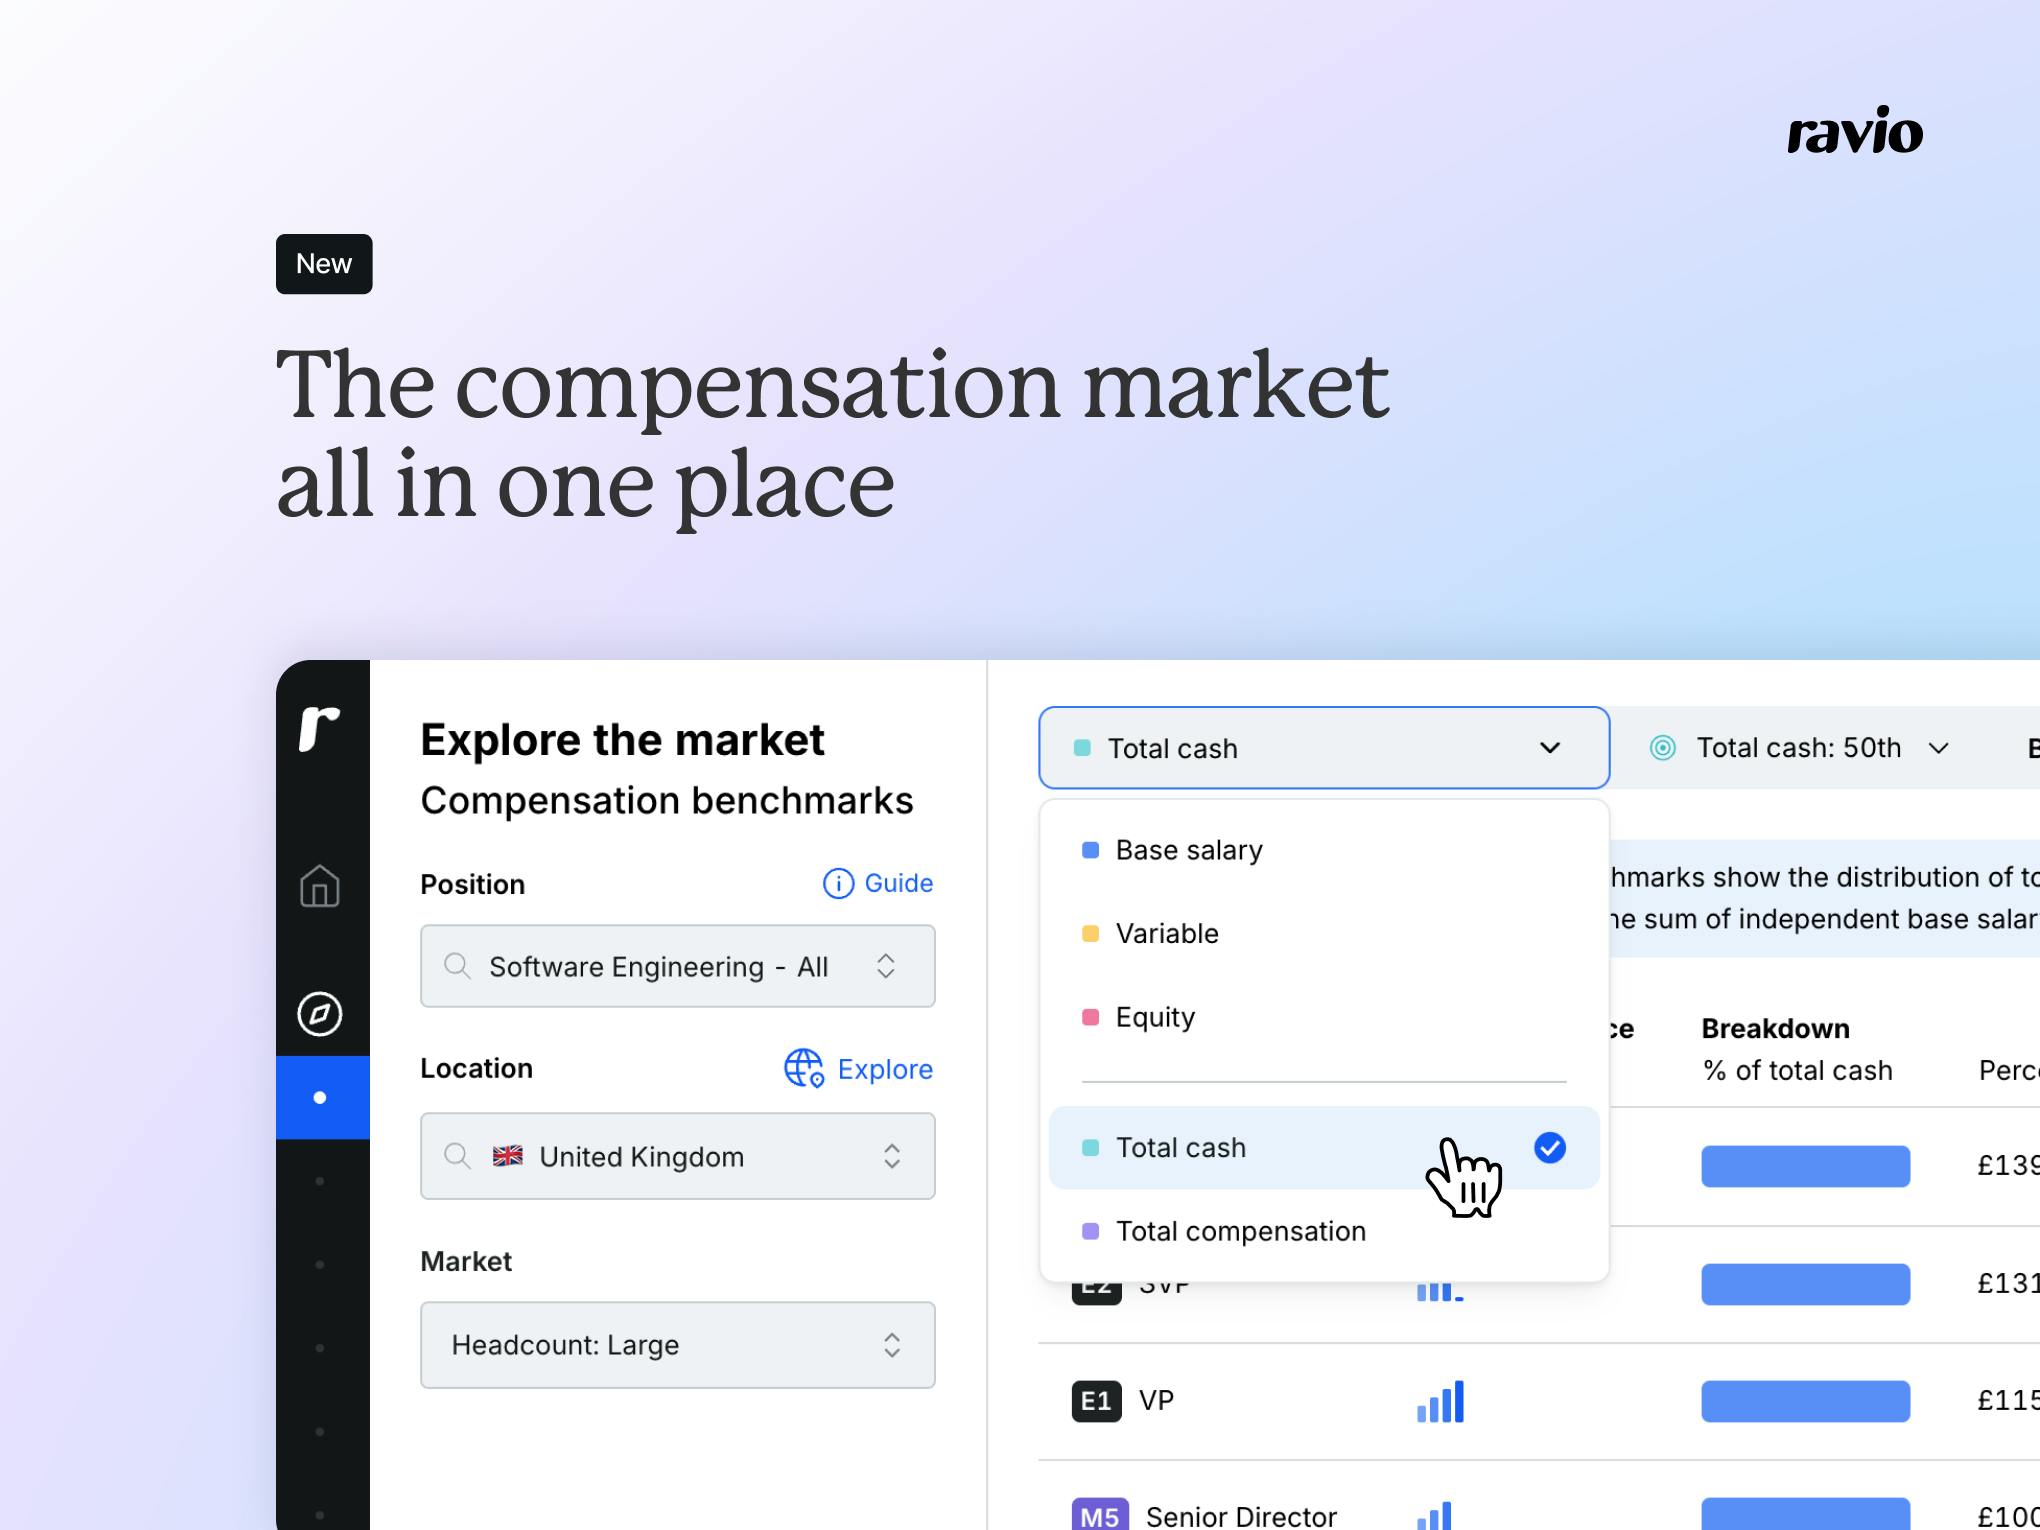
TL;DR: Ravio’s Compensation Benchmarks lets you explore base salary, variable, equity, total cash, and total compensation in a unified experience. Choose your role, refine your peer group, select the location, pick the compensation type – the view adapts instantly, revealing the market from every angle without losing context.
You’re building salary bands for Sales. Six levels, three locations, a full compensation structure.
Base salary sits in one sheet.
Variable in column AY.
Equity in a different report entirely.
Total comp amalgamated in a spreadsheet you really hope doesn’t break.
You pull benchmarks, switch views, align data formatting. Export. Switch again. Export. Stitch it all together.
And then, you realise the numbers don’t quite add up. Time to unpick it, scrutinise the methodology and start over.
Two hours later, you’ve built a patchwork model of the market.
It’s unlikely to be something you’re comfortable defending to a hungry team of sales leaders – for whom compensation is potentially a BIG incentive. What you need is a clear view of the market with a methodology you can trust and stand by.
Compensation Benchmarks unites every compensation type into a consistent experience.
Adjust your inputs:
…and the grid updates instantly – without changing layout, structure, or controls.
Skip the jumping between mismatched data to see different comp types or levels and the stitching together of various spreadsheets.
Cut through to the strategic clarity.
The controls stay the same whether you’re viewing base, variable, equity, total cash or total comp. You always know where you are – even as the benchmarks shift seamlessly between comp types.
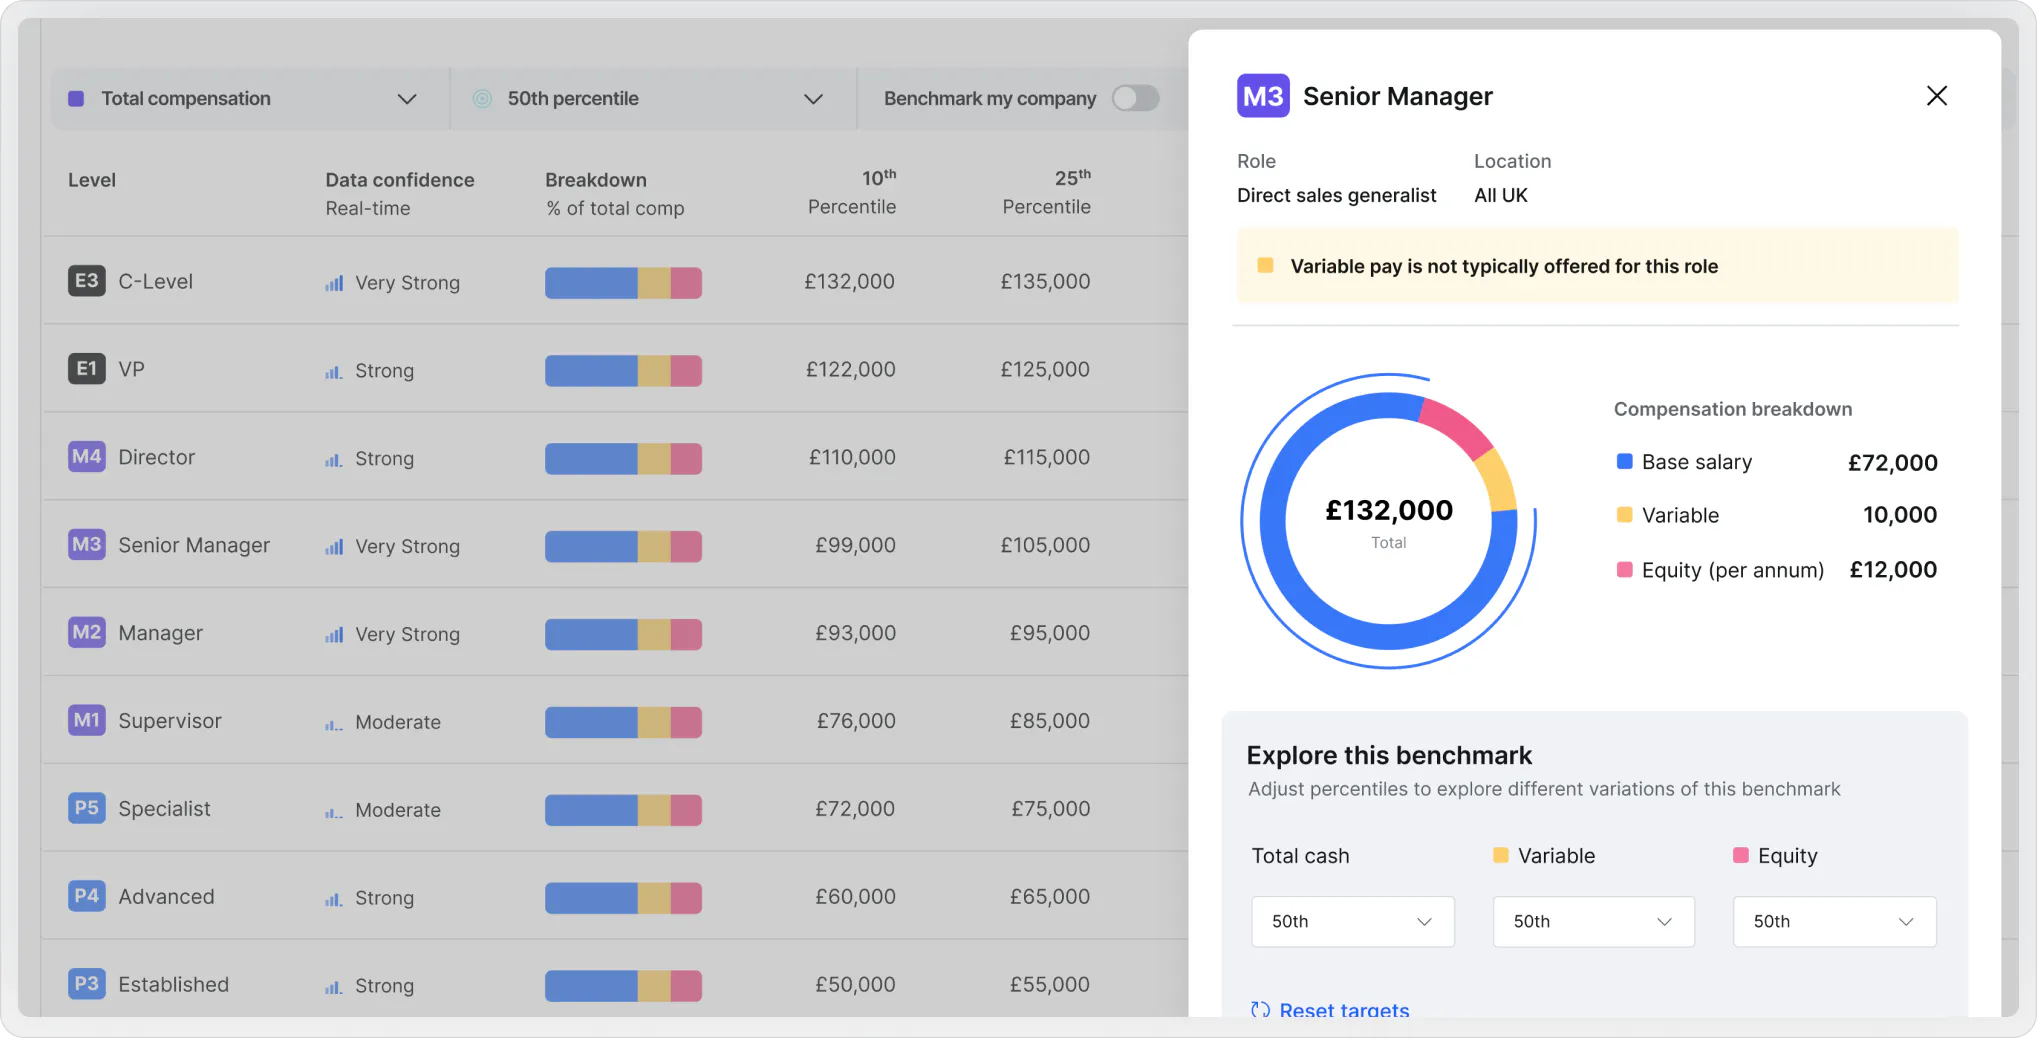
For any role or peer group, you can quickly see:
Our compensation benchmarks give you the confidence of a spreadsheet – without the chaos behind the scenes.
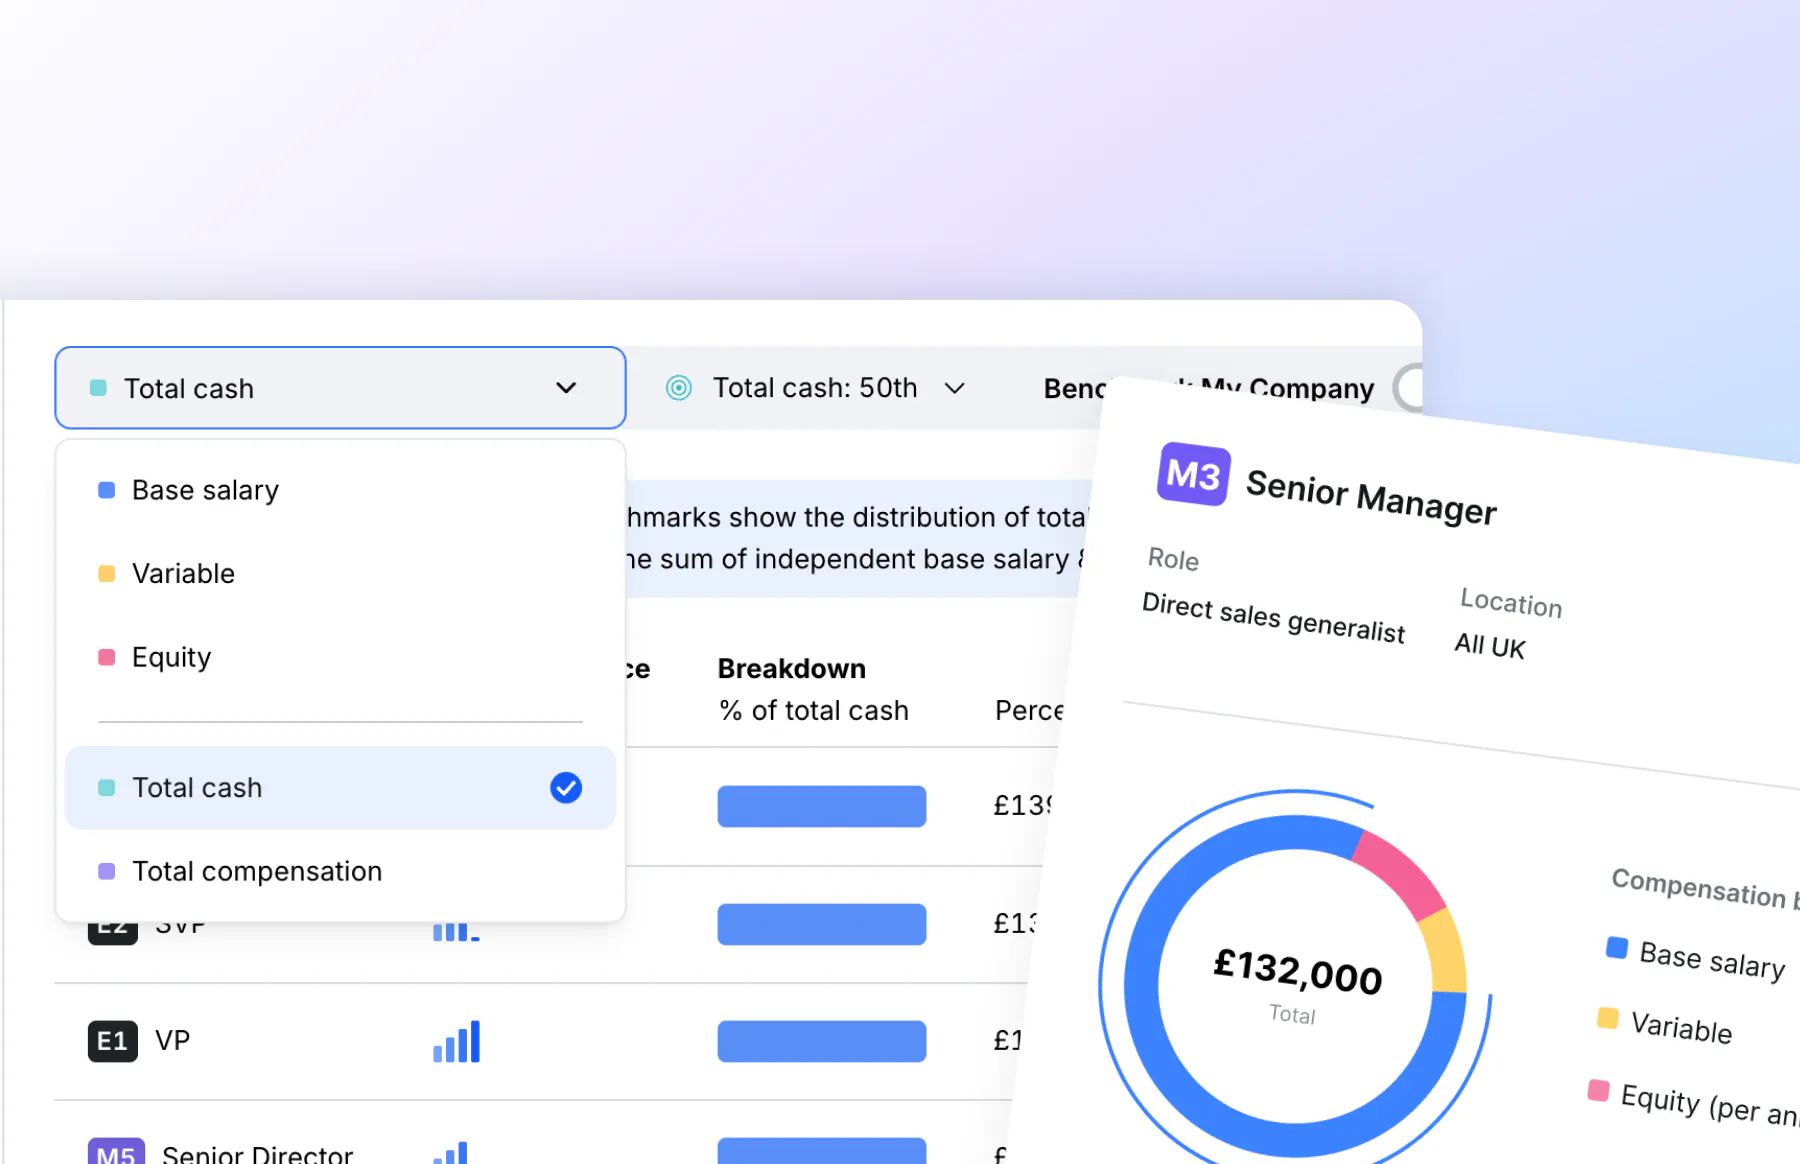
Start from base salary and build up.
Or start from total comp and break it down.
Compensation Benchmarks supports both: each compensation type gets its own dedicated view, and switching is instantaneous.
You can set your preference centrally in your comp philosophy.
Sometimes compensation components don’t stack neatly but don’t worry, that’s by design.
Take the 50th percentile for base (£70k) and the 50th for variable (£14k) – you might think total cash should be £84k.
But the total cash benchmark for the 50th percentile may be £80k.
Why?
Because the employees at 50th percentile of base salary aren’t the same employees at the 50th percentile of variable. The mix of base and variable in compensation packages varies – some roles skew high-base, low-variable; others flip it.
Add percentiles together and you are creating a fictional employee and a skewed figure.
That’s why we produce dedicated total cash benchmarks from actual employee data – to more accurately reflect real compensation to real employees.
Compensation Benchmarks shows the market from multiple angles.
When you need to understand the details of a specific compensation package – the mix between components, confidence levels, and context – you can dig down in our ‘details’ slide out. You can combine benchmarks from different compensation types to build your own benchmark.
Compensation Benchmarks = compare across the market.
View Details = understand an individual package.
Two modes. One platform. Complete clarity.
Compensation is multi-dimensional and your benchmarking experience should match that.
Compensation Benchmarks gives you a consistent, intuitive way to explore every compensation type and the details lifts the lid on how these components come together.
No more fragmented data.
No more manual consolidation.
No more second-guessing.
Just a clearer, faster, more confident way to understand how the market pays.
Your monthly dose of market insights and expert perspectives
Use Ravio to identify pay gaps across your organisation, understand what's driving them, and calculate the cost of closing them.
Ravio has partnered with Comp to bring trusted Brazil benchmarks directly into the Ravio platform.
Ravio now benchmarks up to 300 positions in 46 countries. So you can hire the teams you need to scale