
Pay equity
EU Pay Transparency Directive: the complete guide for employers (2026)
What the EU Pay Transparency Directive requires, how each member state is implementing it, and what employers need to do to comply.

The EU Pay Transparency Directive is the project at the top of every HR team's list for 2026 – and for good reason, there’s a lot to prepare for, and not a lot of time.
The Directive introduces more rigorous, standardised gender pay gap reporting across the EU, with a maximum 5% gender pay gap allowed for the company overall (unadjusted) and for any group of employees who perform equal work or work of equal value (adjusted) – and a requirement for objective justifications and remediation plans for any gaps above that.
So how do EU tech companies currently sit against that 5% threshold?
Well, almost every EU tech company can expect to exceed the 5% threshold when reporting their overall gender pay gap – across the 27 EU member states, the unadjusted gender pay gap currently sits at 18.8% (Ravio data, January 2026).
However, much of this can be justified through the adjusted analysis that the directive requires, by demonstrating that men and women in comparable roles are paid fairly.
The more complex compliance question is: which specific employee groupings are likely to exceed the 5% threshold? This will be much more difficult to justify.
It’s hard to answer definitively because 'equal value' definitions will vary by company. But, as a starting point, we’ve analysed our data to find out where the highest-risk hotspots cluster in terms of functions and job levels.
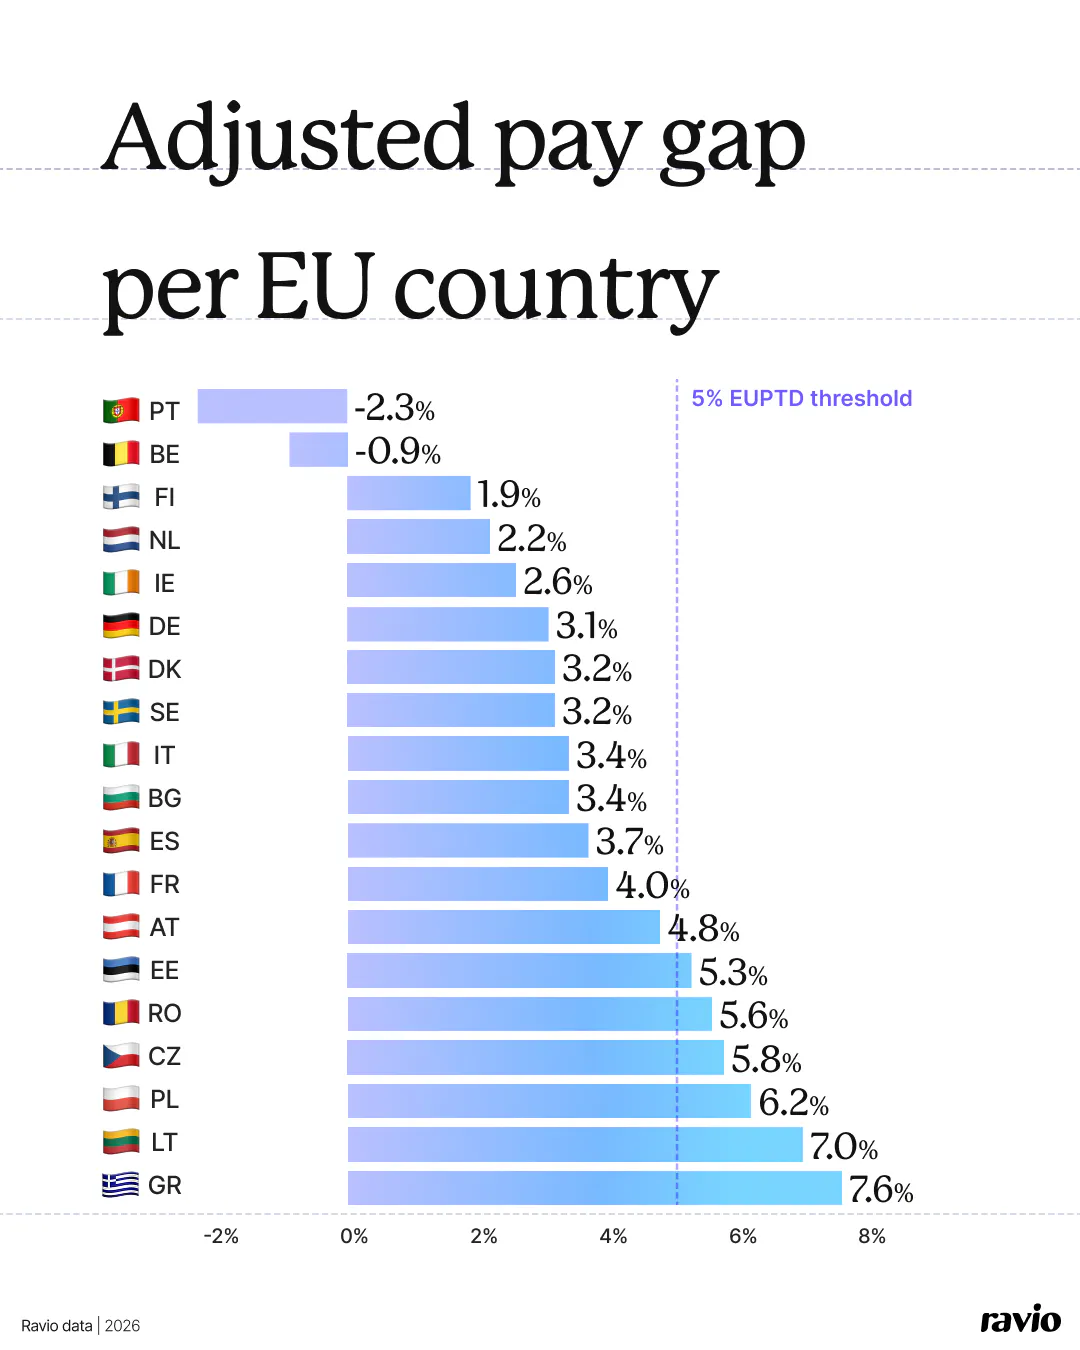
When we adjust for job level and function within each country – comparing like-for-like roles rather than overall workforce averages – most EU member states sit below the 5% limit.
This adjusted view removes the impact of how men and women are distributed across different roles and seniority levels, giving a clearer picture of pay equity for comparable work.
However, there are 6 exceptions to this: Greece (7.6%), Lithuania (7.0% adjusted gender pay gap), Poland (6.2%), Czechia (5.8%), Romania (5.6%), and Estonia (5.3%) – if you employ people in these developing tech markets, your baseline gender pay gap risk may be higher.
One possible explanation is that these locations are developing tech ecosystems where rapid sector growth has meant less time to build mature, standardised compensation structures.
Without clear structures in place, pay decisions rely more heavily on individual negotiation (especially if the talent pool is smaller and less diverse overall) – and research consistently shows men negotiate more frequently and aggressively than women for both starting salaries and raises.
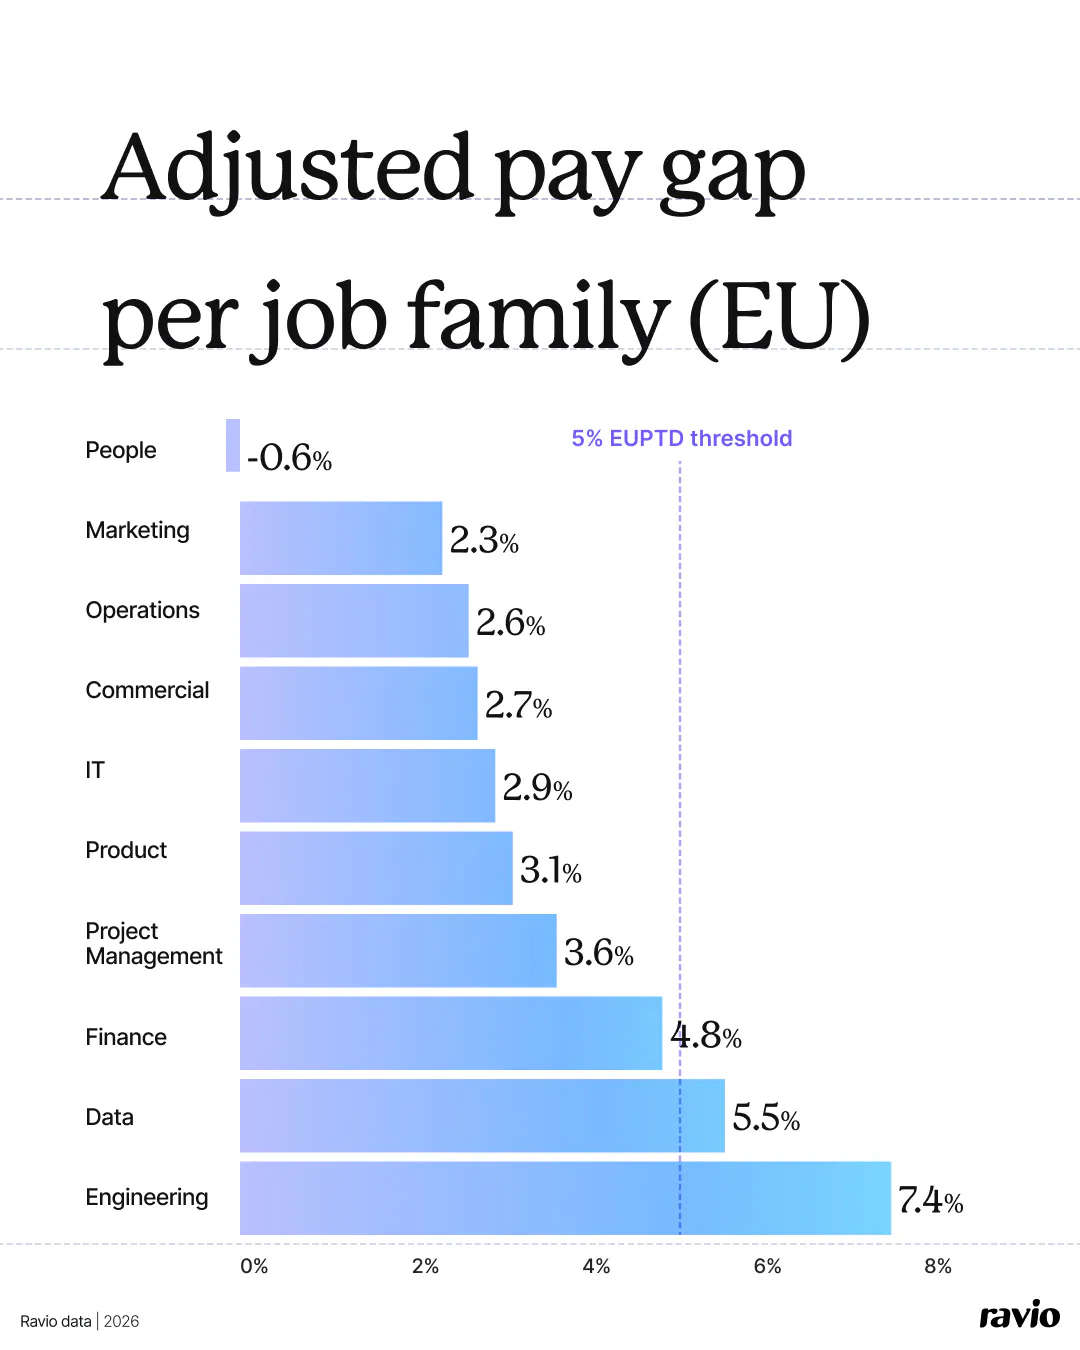
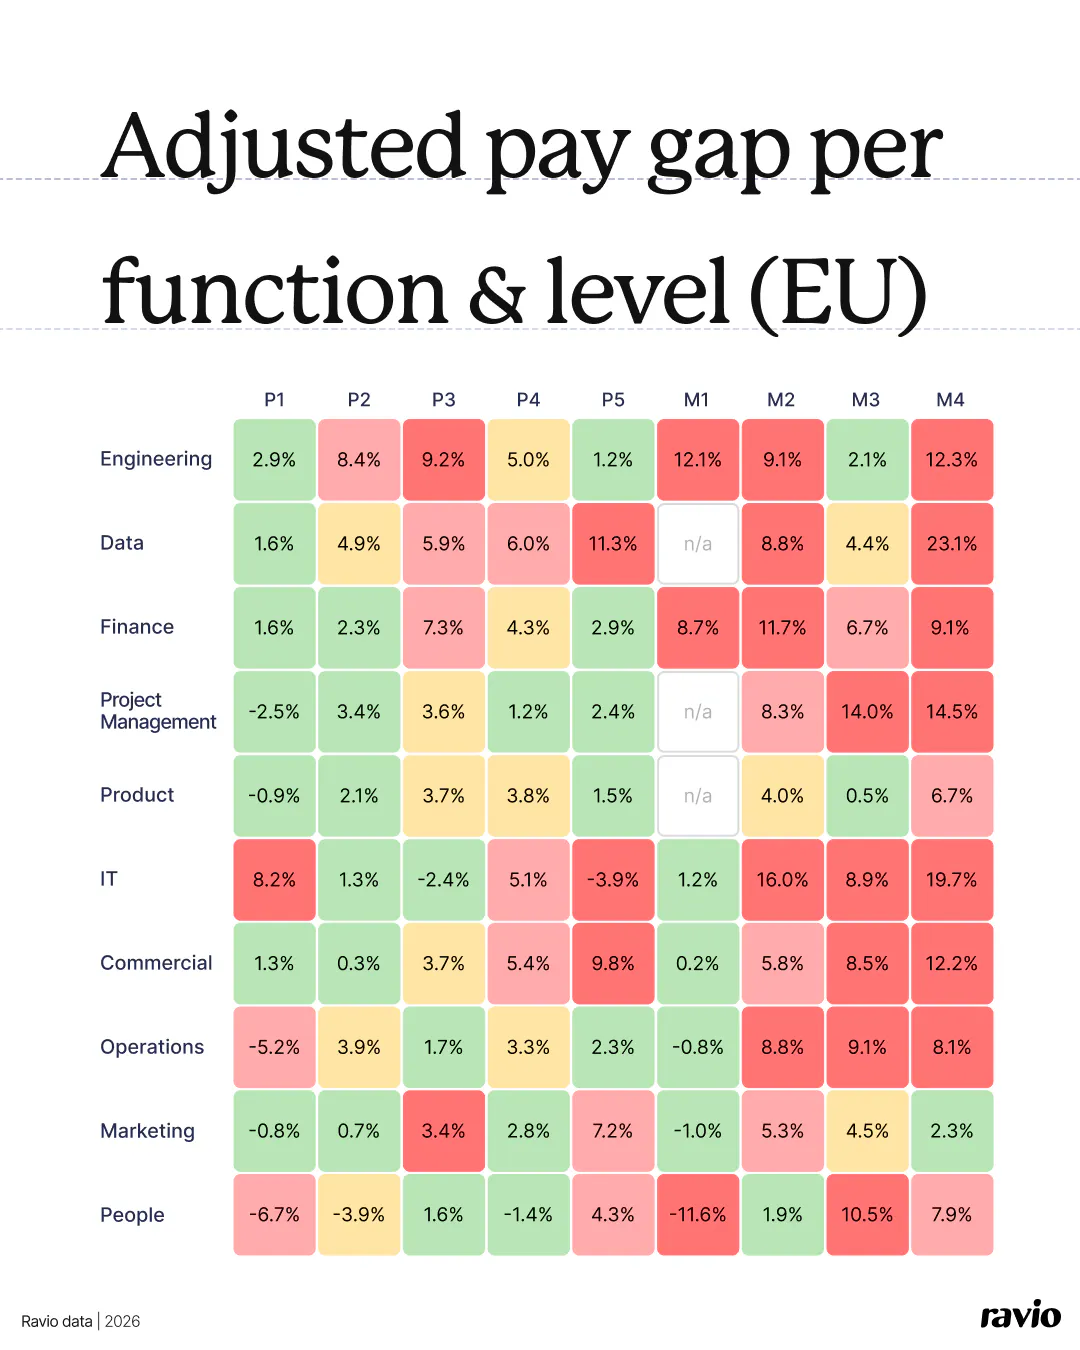
When we look at adjusted GPG by job function, again, most job families sit under the 5% maximum.
However, Engineering (7.4%) and Data (5.5%) both exceed the threshold, with Finance close behind at 4.8%.
These elevated gaps likely stem from these being traditionally male-dominated functions in tech, meaning a compensation decision for one female employee may have an outsized impact on the mean or median adjusted gender pay gap.
Unconscious bias may also be heightened in these more male dominated functions, making an inconsistent decision more likely. For example, research suggests women in male-dominated fields face disadvantages in salary negotiations (both new hire offers and pay rise negotiations) – either negotiating less assertively or facing backlash when they do.
So, if your tech company has large Engineering or Data functions, these may be areas to scrutinise particularly carefully.
Similarly, when we look at adjusted gender pay gap by job level, most levels sit under the 5% target.
However, management levels M2 (6.5%), M3 (6.9%), and M4 (8.5%) all exceed the threshold.
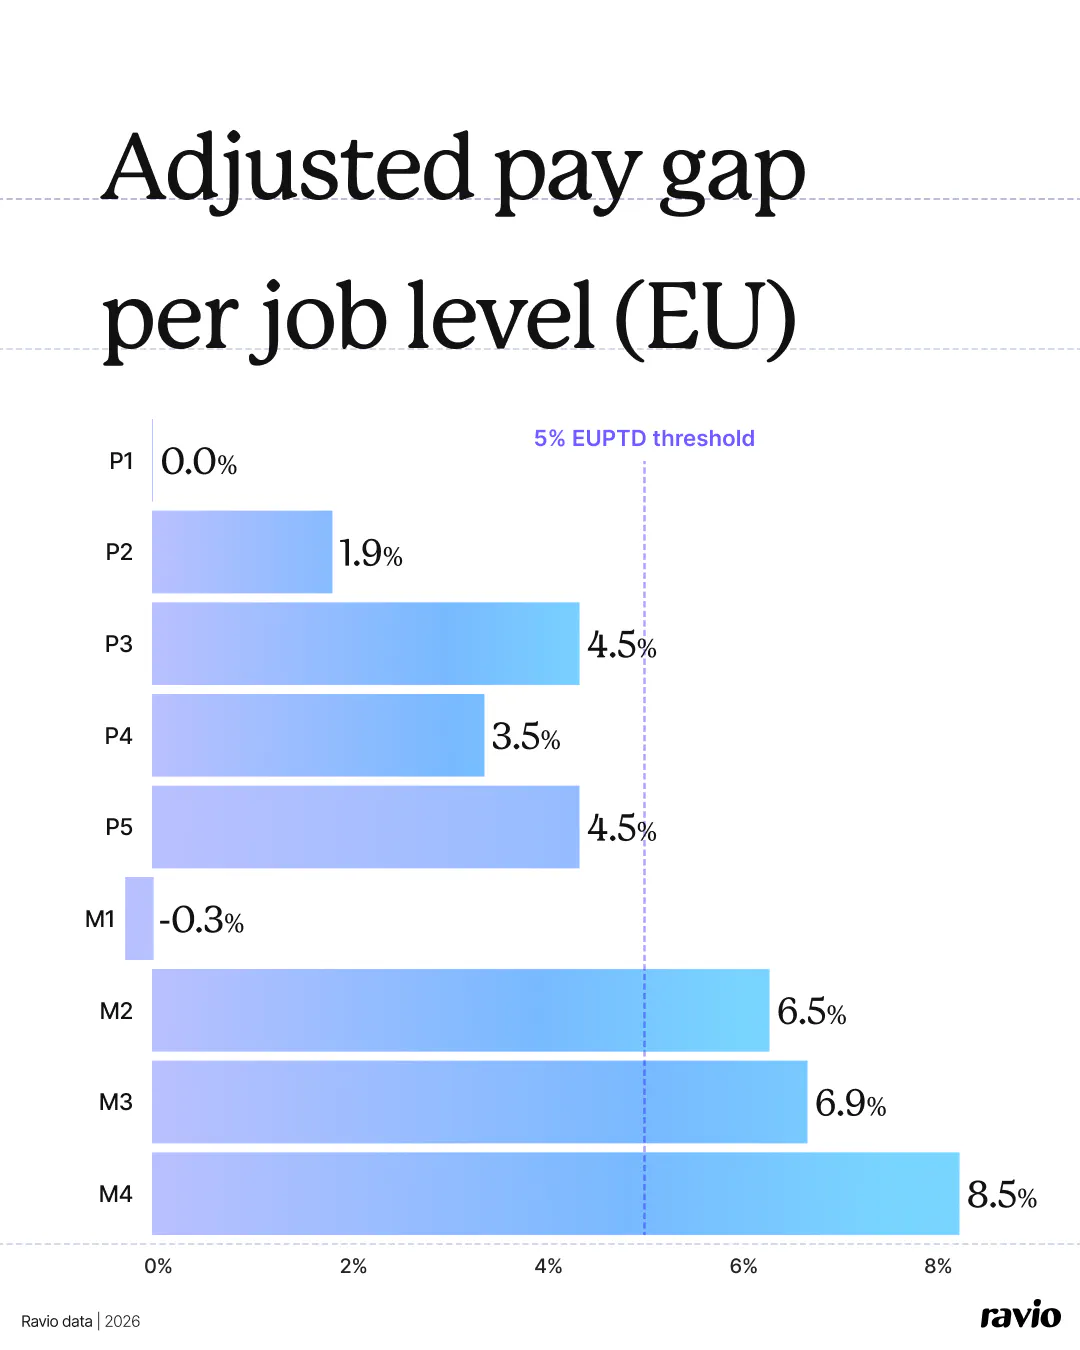
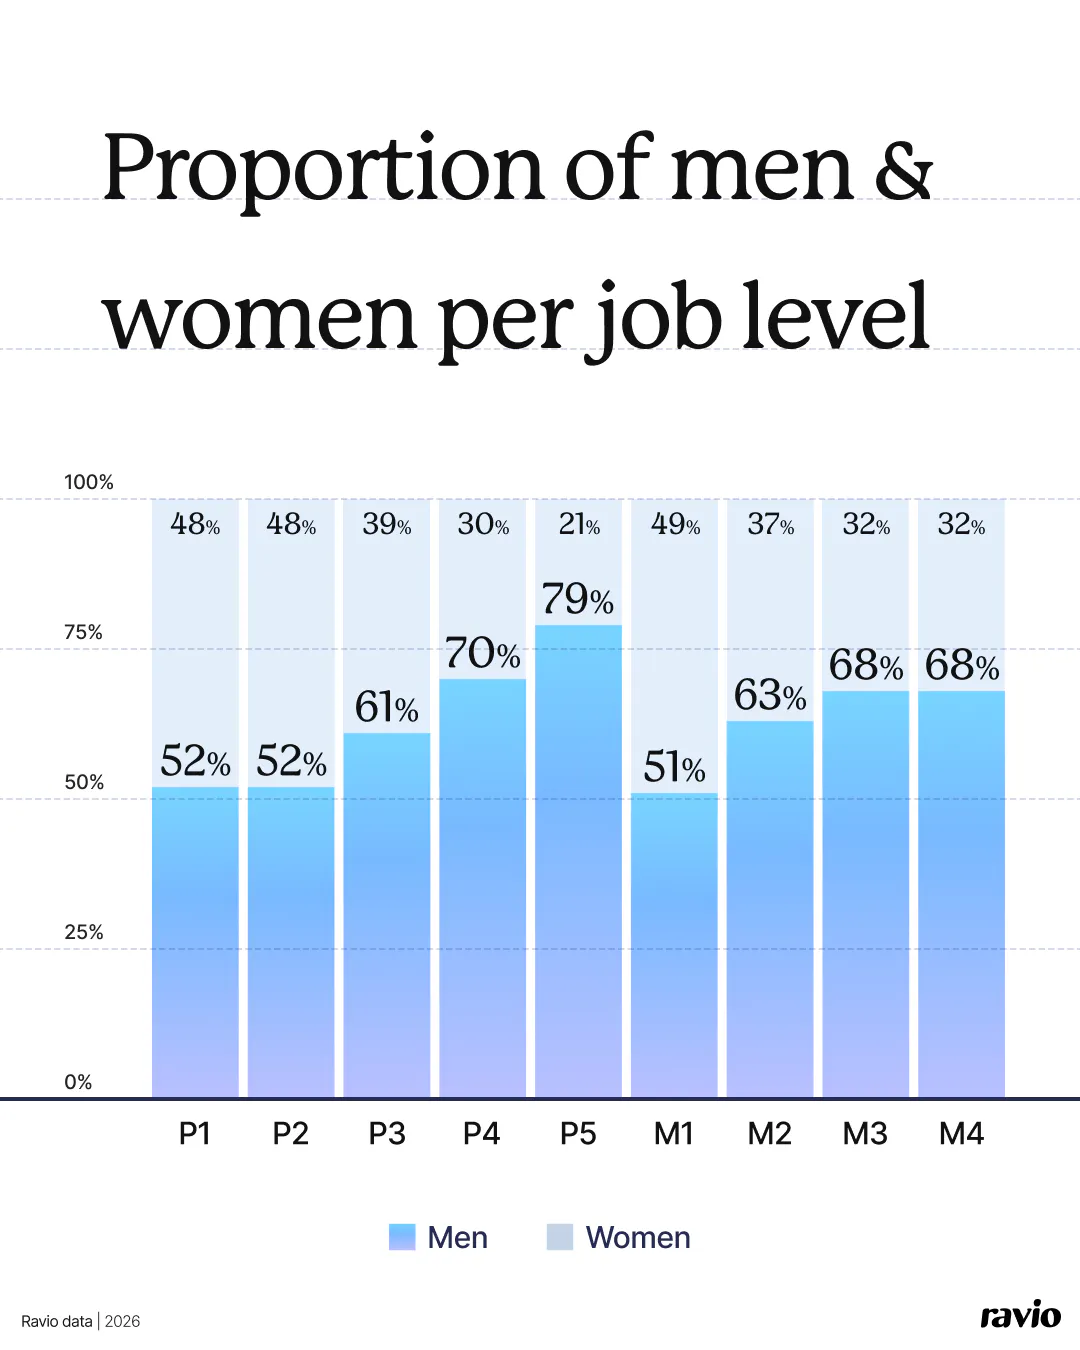
With fewer women reaching senior levels overall, individual compensation decisions have an outsized impact on the adjusted gap.
This could also reflect performance review gender bias tending to worsen at senior levels. Senior roles are often seen to require more 'masculine' traits like assertiveness, creating a double bind for women: those who display these traits face penalties for being perceived as aggressive, while those who don't are viewed as lacking leadership material.
When we combine job function and job level, the pattern continues: pay gaps exceeding 5% are heavily clustered at the intersection of management levels and traditionally male-dominated functions.
Take the M4 level, for instance, where all of the highest pay gaps are in traditionally male-dominated functions: Engineering (12.3%), Data (23.1%), Project Management (14.5%), IT (19.7%), and Finance (9.1%).
This reflects the compounding effect when multiple risk factors align. An M4 Data role in Bulgaria, for instance, combines all three risk factors we’ve identified – location, function, and seniority – amplifying the likelihood of pay gaps.
However, there are notable exceptions of large pay gaps that don't fit this pattern:
Commercial isn't traditionally male-dominated, yet shows elevated gaps at senior levels. The negative gap in M1 People suggests potential overcorrection or different biases operating in female-dominated functions.
We've identified three key risk factors where adjusted gender pay gaps are most likely to exceed the 5% threshold enforced under the EU Pay Transparency Directive:
These hotspots give you a starting framework for identifying which employee groupings to scrutinise most carefully.
But, remember that this is only part of the story. How you define “equal value” work is specific to your company and your evaluation of the relative business value of different roles – per-function and per-seniority analysis is important, but likely not enough.
Use these risk factors as a guide, but layer in your own organisational context to build a complete picture of your adjusted pay gap per grouping, and so where remediation efforts need to focus.
Your monthly dose of market insights and expert perspectives
What the EU Pay Transparency Directive requires, how each member state is implementing it, and what employers need to do to comply.

Use Ravio to identify pay gaps across your organisation, understand what's driving them, and calculate the cost of closing them.

Handpicked Berlin and Ravio are unpacking five findings from the 2026 Berlin Tech Salary Survey – with European benchmark data added in real time.